 Stay
Stay 
Trading Conditions
Products
Tools


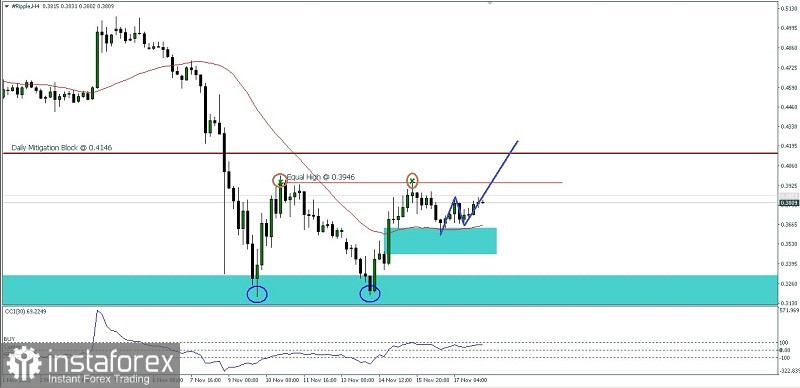
If we look at Ripple's 4-hour chart, a Double Bottom Pattern will appear on this cryptocurrency accompanied by price movements that are above the Moving Average and are restrained by the Bullish Fair Value Gap area level which serves as a strong enough Support Area level to make Ripple which in the near future has the potential to test the level above its current price of 0.3946 as its first target where this level is a gathering place for liquidity (Equal High) and the level of 0.4146 which is the Mitigation Block level from its daily chart will be the next target to be tested but please pay attention to level 0 of the CCI indicator if it is broken down to the bottom plus the level below the current price of 0.3387 is successfully broken down, the upward rally scenario described previously will cancel itself.
(Disclaimer)
InstaForex analytical reviews will make you fully aware of market trends! Being an InstaForex client, you are provided with a large number of free services for efficient trading.


