Trading Conditions
Products
Tools
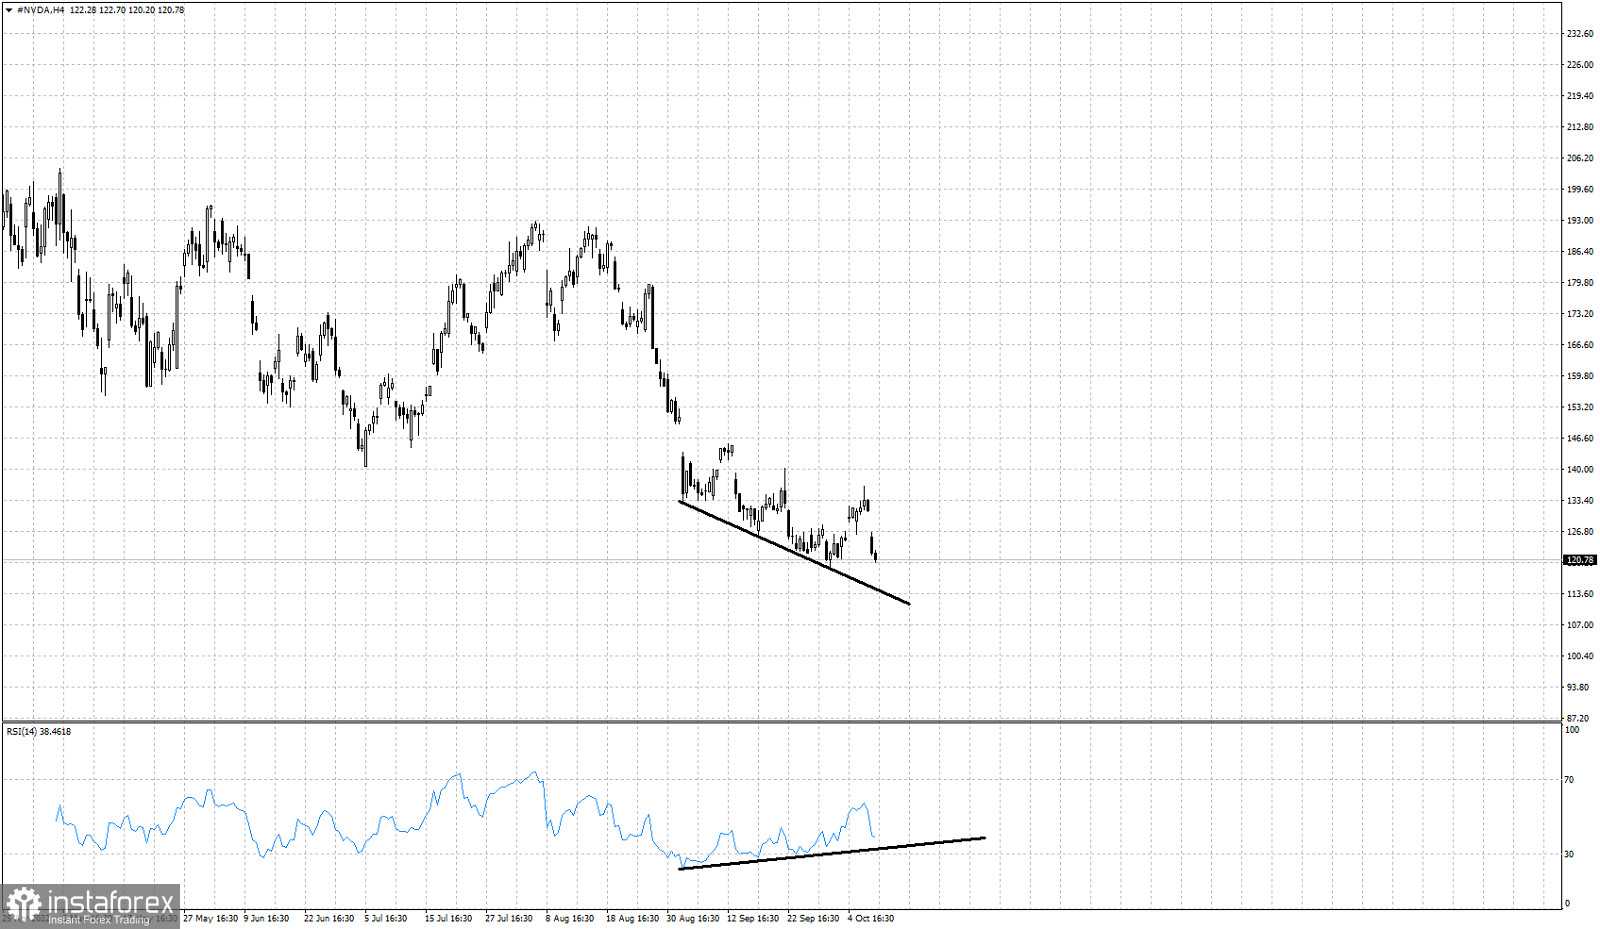
Black lines- bullish divergence
NVDA stock price is in a bearish trend. Price is making lower lows and lower highs. Bears remain in control of the trend. However the RSI in the 4 hour chart is not following price to new lows. Instead the RSI is providing higher lows. This bullish divergence by the RSI suggests that the downtrend is weakening. So far the RSI has provided three higher lows. The bullish RSI divergence is not a reversal signal, only a warning. Price will confirm a trend reversal once it breaks above $136.50. Until then, bears remain in control of the short-term trend.
InstaForex analytical reviews will make you fully aware of market trends! Being an InstaForex client, you are provided with a large number of free services for efficient trading.
We may place cookies for analysis of our visitor data, to improve our website and measure advertising performance. Overall this data is used to provide a better website experience. More information
Your IP address shows that you are currently located in the USA. If you are a resident of the United States, you are prohibited from using the services of Instant Trading EU Ltd including online trading, online transfers, deposit/withdrawal of funds, etc.
If you think you are seeing this message by mistake and your location is not the US, kindly proceed to the website. Otherwise, you must leave the website in order to comply with government restrictions.
Why does your IP address show your location as the USA?
Please confirm whether you are a US resident or not by clicking the relevant button below. If you choose the wrong option, being a US resident, you will not be able to open an account with InstaForex anyway.
We are sorry for any inconvenience caused by this message.