 Stay
Stay 
Trading Conditions
Products
Tools


UK retail sales data showed a slowdown in the rate of decline from -3.3% to -3.1%. The actual data matched the forecast.
The main event on Friday was the publication of business activity indices in Europe, the United Kingdom, and the United States. According to the PMI statistical indicators, the Eurozone services PMI rose from 55.0 to 56.6 points, while the manufacturing PMI fell from 47.3 to 45.5 points. As a result, the composite business activity index increased from 53.7 to 54.4 points, while it was predicted to remain at 53.7 points.
In the United Kingdom, the business activity index in the services sector rose from 52.9 to 54.9 points, while in the manufacturing sector, the index fell from 47.9 to 46.6 points. As a result, the composite business activity index increased from 52.2 to 53.9 points.
In the United States, the business activity index in the services sector rose from 52.6 to 53.7 points, although it was forecasted to drop to 51.5 points. In the manufacturing sector, the index also showed growth from 49.2 to 50.4 points. As a result, the composite business activity index increased from 52.3 to 53.5 points.
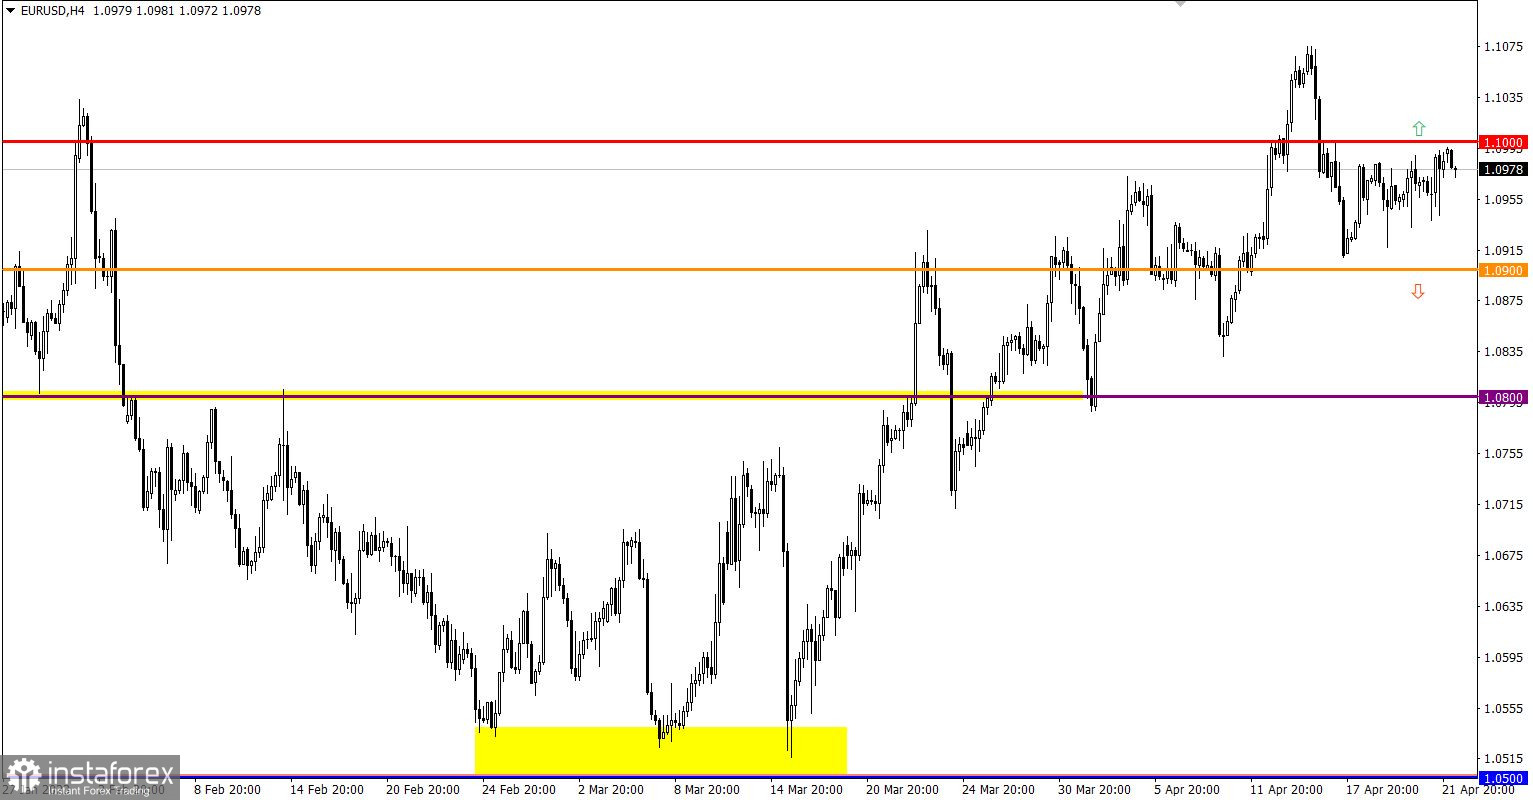
Throughout the past week, the EURUSD pair moved in a narrow range, which formed slightly below the control level of 1.1000. Such price fluctuations can be classified as an accumulation of trading forces in the market.
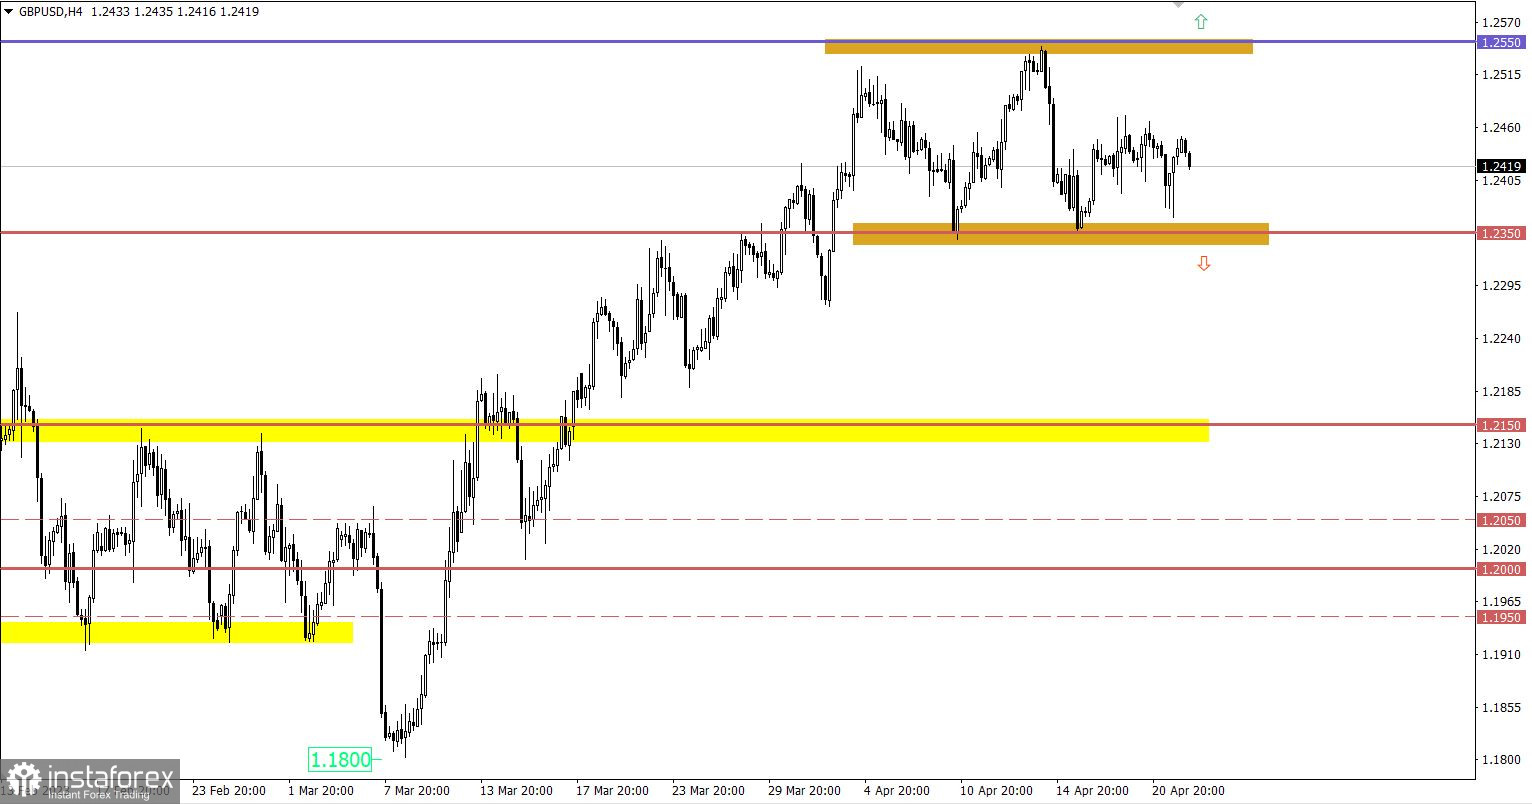
GBPUSD showed a local downward interest but did not lead to anything radical. The quote continued to move within the lateral range of 1.2350/1.2550, eventually working out its lower boundary.

The economic calendar is traditionally empty on Mondays. No important reports are expected in the EU, the United Kingdom, and the United States.
In this regard, investors and traders intend to focus on the incoming information and news flow.
It can be assumed that the market stagnation will soon end, and speculative activity will take its place. If this happens, holding the price above the 1.1000 level will lead to an increase in the volume of long positions. In turn, this can lead to an update of the local high of the medium-term trend.
At the same time, if the price is held below the 1.0900 value, it may lead to a continuation of the corrective movement. This means that further price declines may lead to a continuation of the current corrective trend.
Market participants continue to use two main strategies: the bounce tactic and the breakout method to determine market entry and exit points.
The bounce tactic is used when the price approaches a certain range boundary and rebounds from it. This strategy allows market participants to enter and exit positions based on certain price levels.
The breakout method is considered the main strategy because it can indicate the direction of price movement. This strategy is used when a certain price level is overcome, which may signal a possible change in the fluctuation cycle.
The candlestick chart type is white and black graphic rectangles with lines above and below. With a detailed analysis of each individual candle, you can see its characteristics relative to a particular time frame: opening price, closing price, intraday high and low.
Horizontal levels are price coordinates, relative to which a price may stop or reverse its trajectory. In the market, these levels are called support and resistance.
Circles and rectangles are highlighted examples where the price reversed in history. This color highlighting indicates horizontal lines that may put pressure on the asset's price in the future.
The up/down arrows are landmarks of the possible price direction in the future.
InstaForex analytical reviews will make you fully aware of market trends! Being an InstaForex client, you are provided with a large number of free services for efficient trading.


