 Stay
Stay 
Trading Conditions
Products
Tools


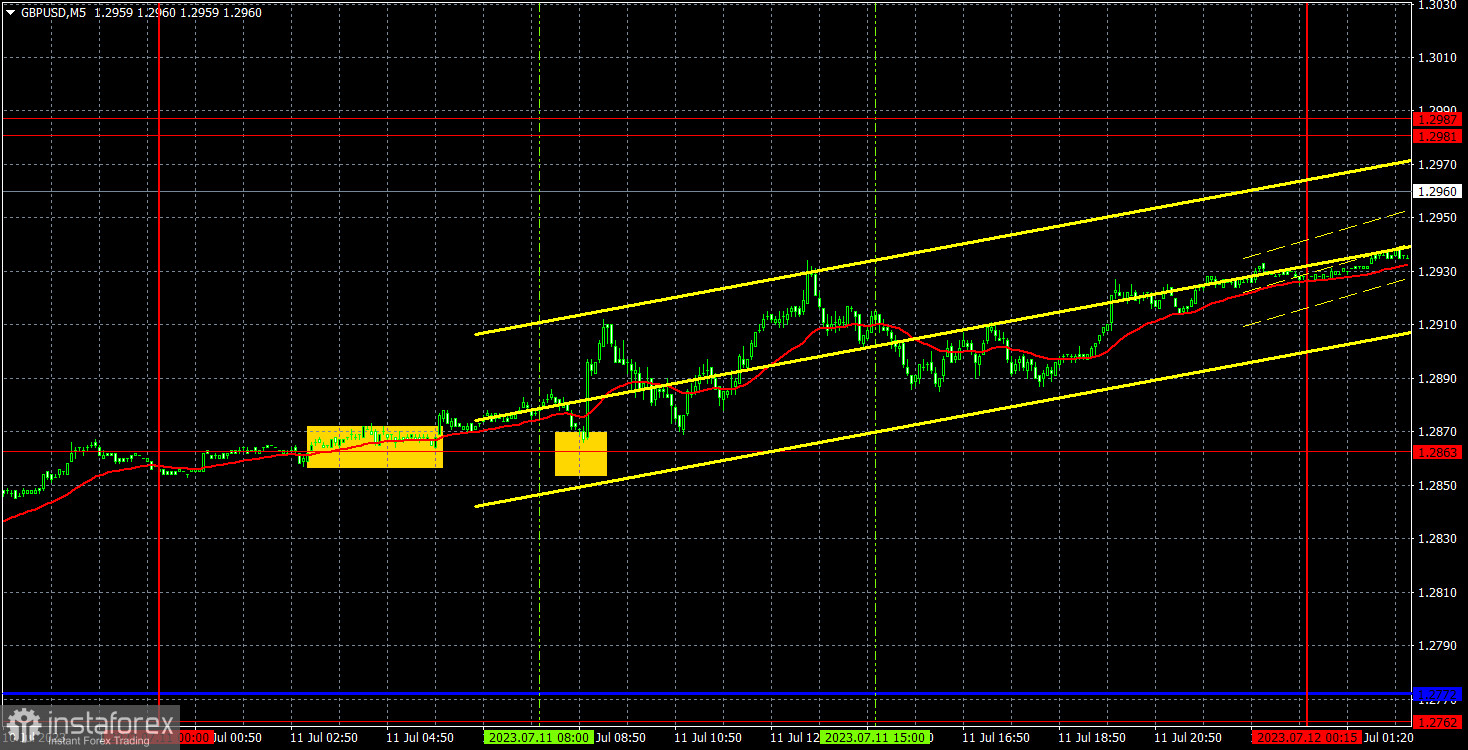
The GBP/USD pair achieved gains on Tuesday, with volatility around 80 points. It might seem small, but it still rose 80 pips. Yesterday was a good example of how a pair can move if the market looks only in one direction. In the morning, three important reports came out in the UK, at least two of which were weak. Unemployment rose, unemployment benefit claims exceeded the forecast by almost 50,000. The wage report exceeded the forecast by only 0.1% and clearly could not cover the two unemployment reports and at the same time provoke a rise by another 80 points. Thus, the market continues to do its job - simply buy the pound, occasionally taking short breaks, during which the British currency does not even have time to correct properly.
There were two entry points yesterday, which duplicated each other. First, the pair crossed the 1.2863 level, and then it bounced off this mark from above. All this happened early in the morning, so traders could go long at the very beginning of the day. Then the pair grew for almost the entire day, so by the end of the day, traders could close the deal with a profit of about 30 points.
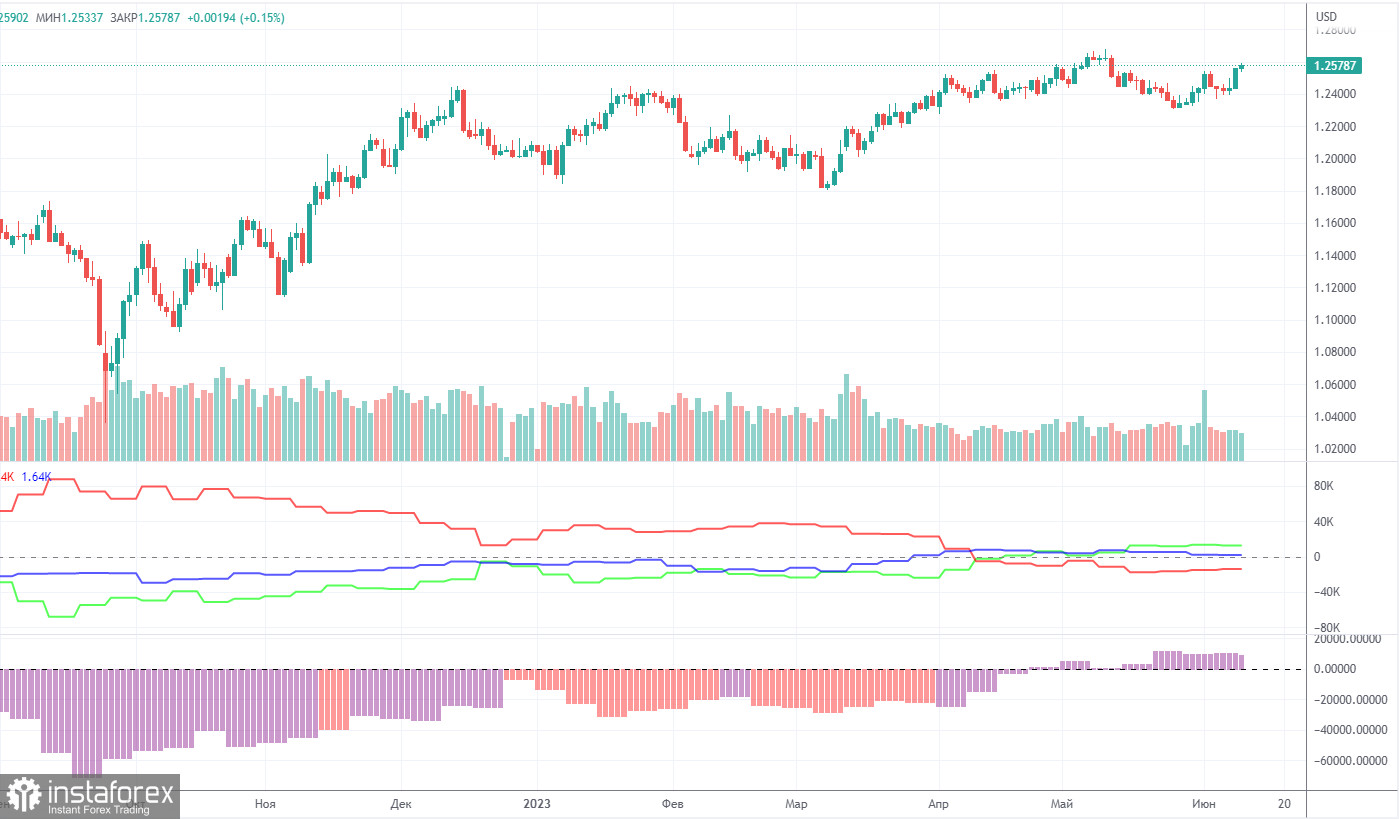
According to the latest report, the "Non-commercial" group of traders closed 7,900 long positions and 6,100 short ones. Thus, the net position of non-commercial traders decreased by 1,800 positions in a week but in general it continued to rise. The net position has been steadily growing over the past 10 months as well as the pound sterling. Now, the net position has advanced markedly. This is why the pair will hardly maintain its bullish momentum. I believe that a long and protracted downward movement should begin. COT reports signal a slight growth of the British currency but it will not be able to rise in the long term. There are no drivers for opening new long positions. However, there are no technical signals for short positions yet.
The British currency has already grown by a total of 2,500 pips. Without a downward correction, the continuation of the uptrend will be illogical. The Non-commercial group of traders has opened 96,500 long positions and 46,100 short ones. Such a gap means the end of the uptrend. I remain skeptical about the long-term growth of the pound sterling but speculators continue to buy because the pair is growing. Usually, BTC shows such movements.
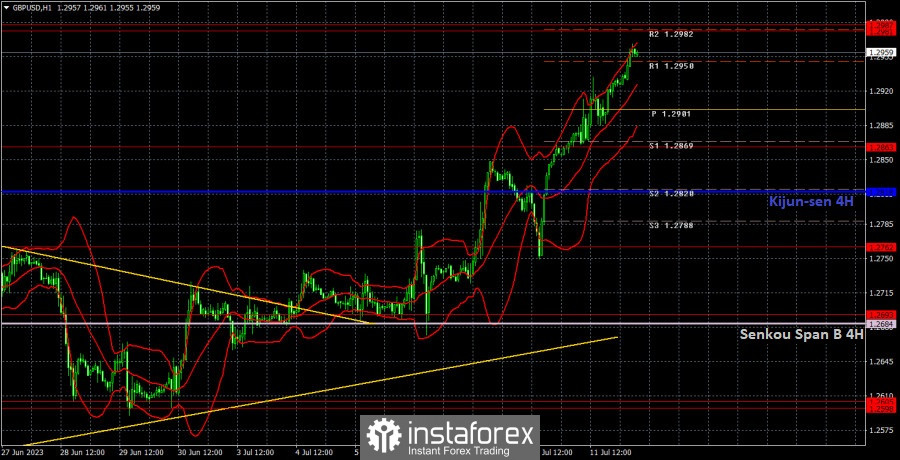
In the 1-hour chart, GBP/USD maintains a bullish bias and is rapidly rising. The ascending trend line serves as a buy signal. However, the pound sterling is overbought. It is likely to decline in the medium term. From a technical perspective, the pound has all the necessary reasons to extend the upward movement, and the market is happy to use any opportunity to sell the dollar. There are no signs of the upward movement ending anytime soon.
On July 12, trading levels are seen at 1.2598-1.2605, 1.2693, 1.2762, 1.2863, 1.2981-1.2987, 1.3050, 1.3119. Senkou Span B lines (1.2684) and Kijun-sen (1.2818) lines can also provide signals, e.g. rebounds and breakout of these levels and lines. It is recommended to set the Stop Loss orders at the breakeven level when the price moves in the right direction by 20 pips. The lines of the Ichimoku indicator can move during the day, which should be taken into account when determining trading signals. There are support and resistance levels that can be used to lock in profits.
On Wednesday, no important events lined up in the UK. The main item on today's agenda is the US inflation report, which the market has probably considered, since it's impossible to explain the pound's growth. Therefore, we might see the dollar rise, as any positive value of the report has already been traded. Unless inflation for June drops more than to 3.1%. Then the pound may trade higher.
Resistance/support - thick red lines, near which the trend may stop. They do not make trading signals.
The Kijun-sen and Senkou Span B lines are the Ichimoku indicator lines moved to the hourly timeframe from the 4-hour timeframe. They are also strong lines.
Extreme levels are thin red lines, from which the price used to bounce earlier. They can produce trading signals.
Yellow lines are trend lines, trend channels, and other technical patterns.
Indicator 1 on the COT chart is the size of the net position of each trader category.
Indicator 2 on the COT chart is the size of the net position for the Non-commercial group of traders.
InstaForex analytical reviews will make you fully aware of market trends! Being an InstaForex client, you are provided with a large number of free services for efficient trading.

