 Stay
Stay 
Trading Conditions
Products
Tools


The European Central Bank (ECB) has decided to raise all three interest rates by 0.25 percentage points. This is the tenth increase since July 2022. The main refinancing rate has reached 4.5%, the deposit rate has increased to 4%, and the marginal lending rate has risen to 4.75%. These interest rate levels are comparable to those during the dot-com crisis.
The ECB's decision to raise rates met market expectations. However, the bank gave a clear signal that it considers the current interest rate levels sufficient to stabilize inflation if they are maintained for a "sufficiently long period of time." Nevertheless, the regulator left the possibility for further rate hikes open, noting that it will continue to closely monitor economic data and may consider additional measures in the hopes of reducing inflation.
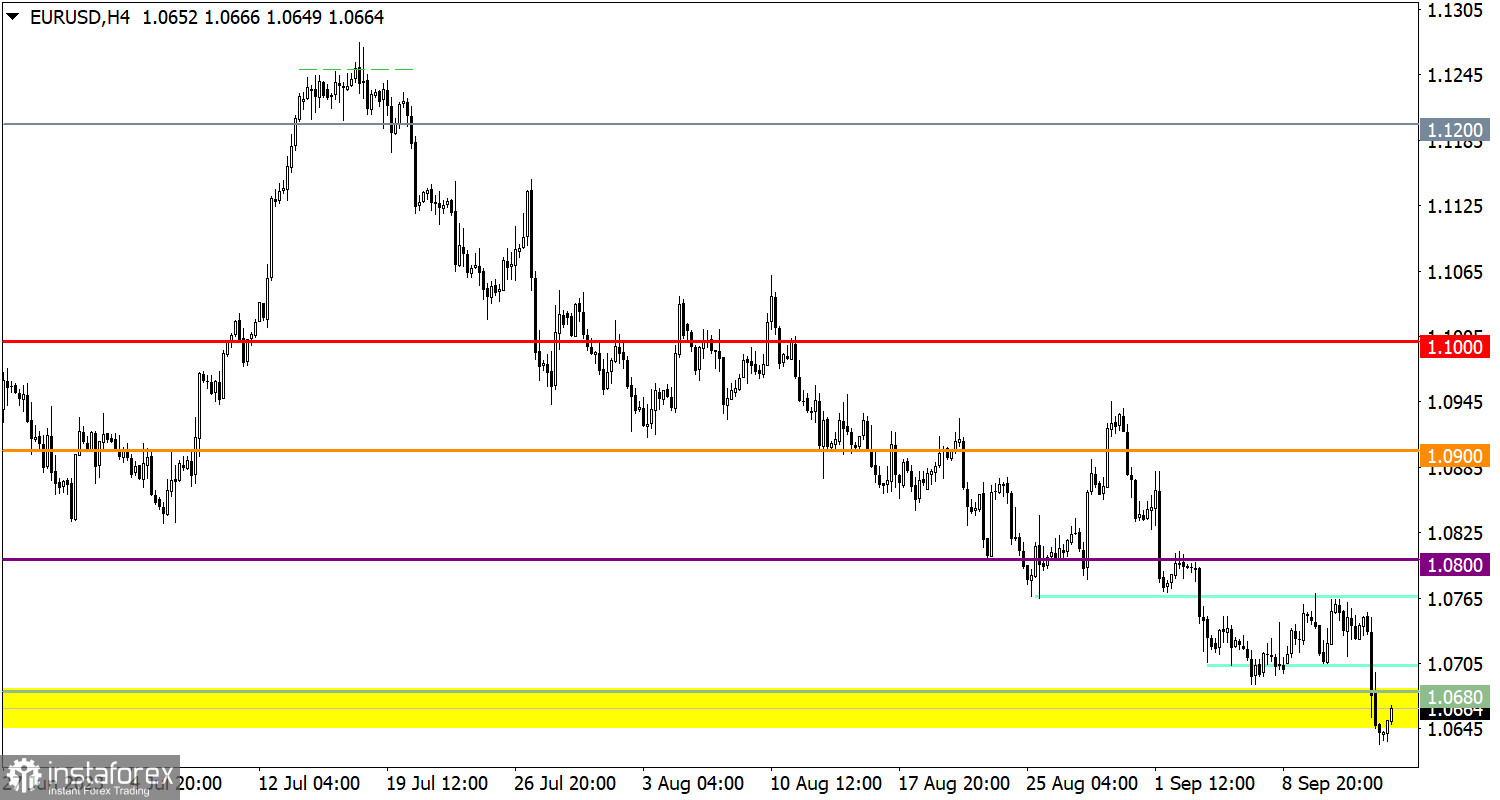
Following the European Central Bank (ECB) meeting, the EUR/USD currency pair started a sharp decline, influenced by a strong information background. The exchange rate quickly fell below the 1.0650/1.0680 trading force interaction level, indicating a prevailing bearish sentiment among market participants.
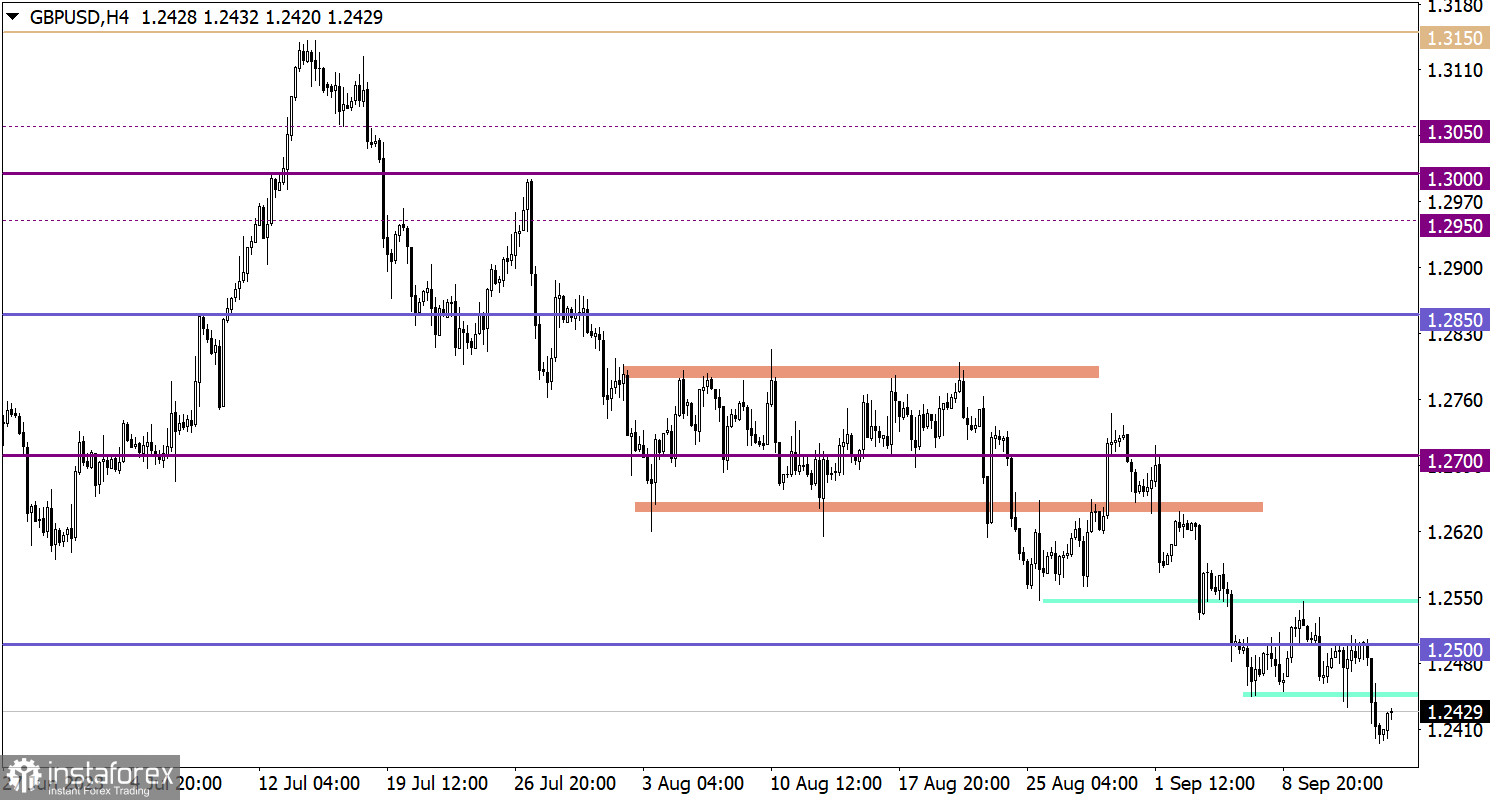
Similarly, the GBP/USD pair also declined after the ECB meeting, resulting in a new local low in the current downward trend cycle.
Today, data on industrial production in the United States is expected to be published, with the pace of decline potentially accelerating from -0.2% to -0.5%. This is a negative factor for the economy, which could weaken the dollar's positions.
Time-targeting:
U.S. Industrial production – 13:15 UTC
Despite the extension of the downward trend cycle, there is a technical signal indicating that the dollar is overbought. This could trigger a rebound, allowing the euro to partially recover its value after the recent decline. However, for further decline, it is sufficient for traders to keep the exchange rate below the 1.0650 level. In such a case, the downward trend may continue towards the 1.0500 level.
In this situation, dollar positions appear overheated, which may indicate the possibility of a price pullback to the 1.2500 level. However, if speculators choose to ignore technical signals of oversold conditions and the exchange rate continues to stay below the 1.2450 level, it could lead to a continuation of the downward trend.
The candlestick chart type is white and black graphic rectangles with lines above and below. With a detailed analysis of each individual candle, you can see its characteristics relative to a particular time frame: opening price, closing price, intraday high and low.
Horizontal levels are price coordinates, relative to which a price may stop or reverse its trajectory. In the market, these levels are called support and resistance.
Circles and rectangles are highlighted examples where the price reversed in history. This color highlighting indicates horizontal lines that may put pressure on the asset's price in the future.
The up/down arrows are landmarks of the possible price direction in the future.
InstaForex analytical reviews will make you fully aware of market trends! Being an InstaForex client, you are provided with a large number of free services for efficient trading.

