 Stay
Stay 
Trading Conditions
Products
Tools


The number of open vacancies in the USA has significantly increased, rising by 690,000 compared to the previous month, reaching 9.61 million in August 2023. This growth significantly exceeded the consensus forecast, which expected 8.8 million open vacancies. These data indicate the resilience of the labor market, despite the actions of the Federal Reserve System to tighten monetary policy.
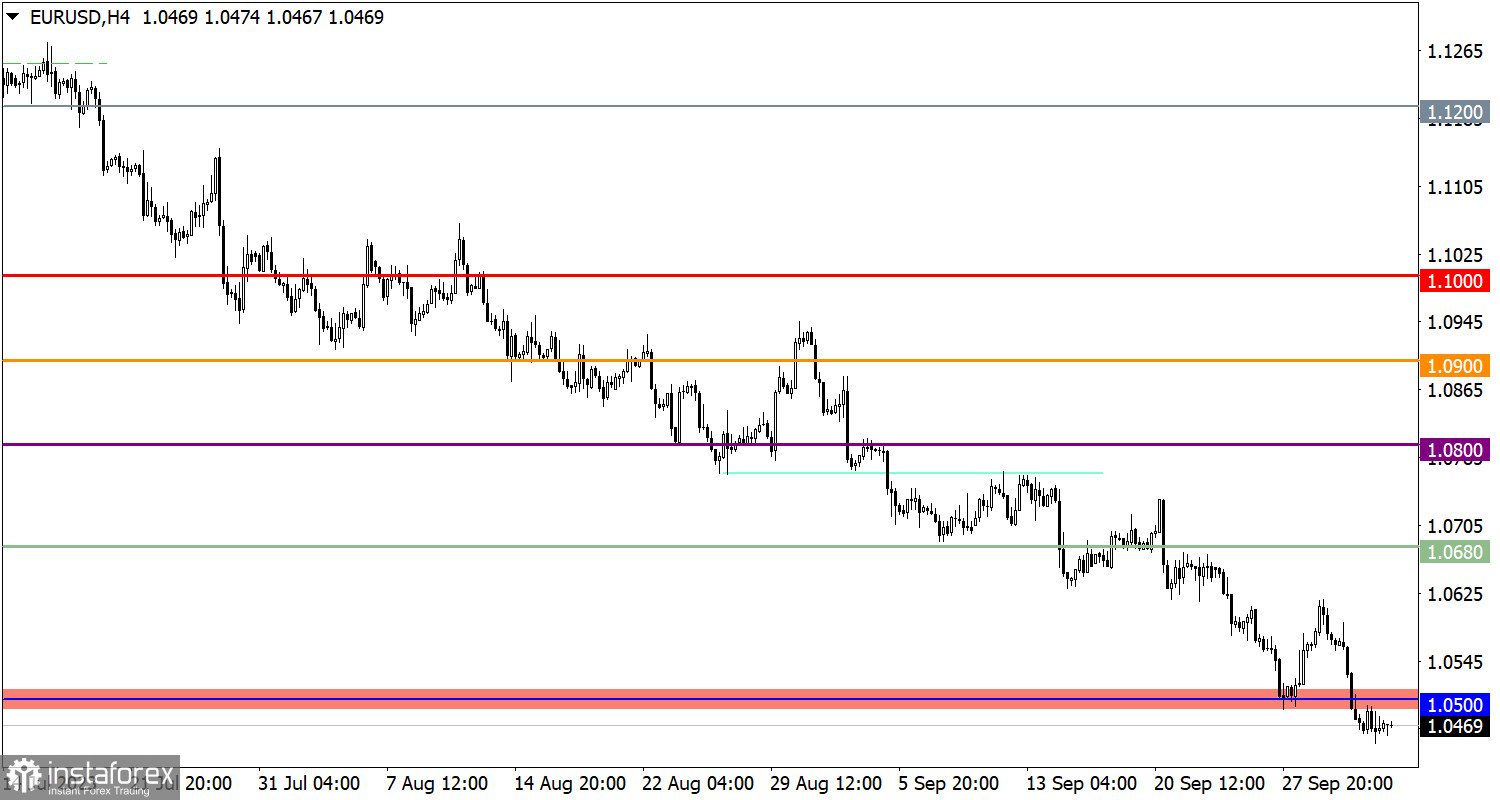
The EUR/USD currency pair managed to stabilize below the 1.0500 level, despite a pronounced technical signal of oversold conditions. This movement indicates a prevailing bearish sentiment among market participants.
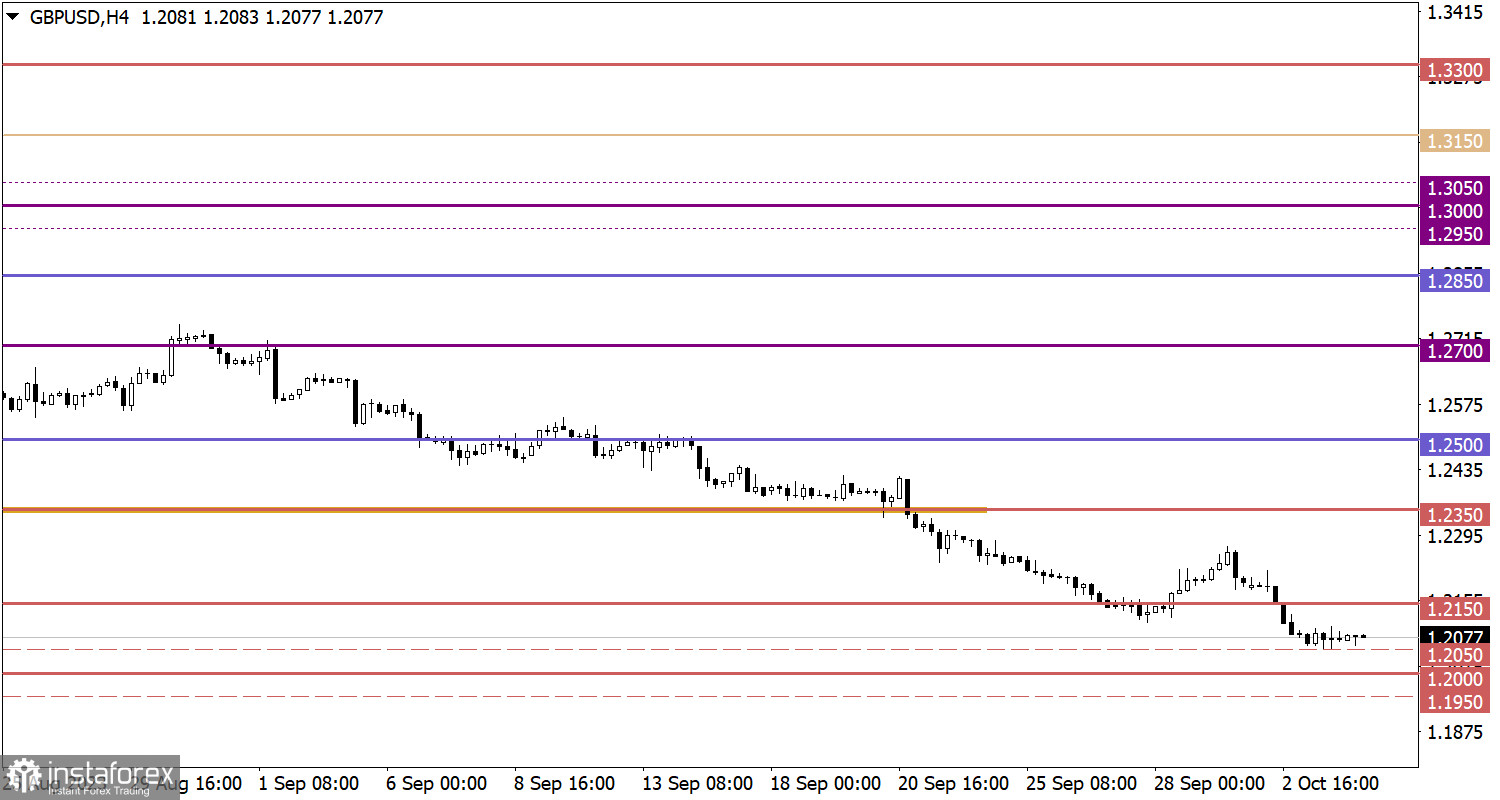
On the other hand, the GBP/USD pair reached the upper boundary of the psychological level of 1.2000/1.2050 during its momentum. This led to a reduction in short positions and, as a result, a temporary slowdown in the downward trend.
Today, the final data on business activity indices in the services sector for Europe, the United Kingdom, and the United States are expected to be published. If these indicators align with preliminary estimates, there may not be a significant market reaction. However, speculators may pay special attention to the publication of producer price data in the EU. Forecasts suggest an acceleration of the rate of decline from -7.6% to -11.6%. This indicates ongoing deflation, which, in turn, could signal an imminent reduction in interest rates by the regulator.
During the American trading session, particular attention will be given to the ADP employment report in the private sector of the United States. It is expected that this report will show employment growth at the level of 160,000, which may indicate a slowdown in the U.S. labor market.
It is expected that further growth in short positions in the euro may occur if the price remains below the 1.0450 level. In this case, a decline in price to the level of 1.0350 is possible. Regarding corrective movement, for its consideration relative to these levels, the price needs to return above the 1.0500 level, at least on a four-hour basis.
Despite an obvious technical signal of oversold conditions for the British pound, the bearish sentiment still prevails in the market. Therefore, the current consolidation may serve as a phase of trader repositioning. If the price stays below the 1.2050 level, it may lead to further declines in quotes, possibly down to the lower boundary of the psychological level of 1.1950/1.2000. As for corrective movement, it would require the price to first return above the 1.2100 level.
The candlestick chart type is white and black graphic rectangles with lines above and below. With a detailed analysis of each individual candle, you can see its characteristics relative to a particular time frame: opening price, closing price, intraday high and low.
Horizontal levels are price coordinates, relative to which a price may stop or reverse its trajectory. In the market, these levels are called support and resistance.
Circles and rectangles are highlighted examples where the price reversed in history. This color highlighting indicates horizontal lines that may put pressure on the asset's price in the future.
The up/down arrows are landmarks of the possible price direction in the future.
InstaForex analytical reviews will make you fully aware of market trends! Being an InstaForex client, you are provided with a large number of free services for efficient trading.

