 Stay
Stay 
Trading Conditions
Products
Tools


Tuesday's Deal Analysis:
1H chart of the GBP/USD pair.
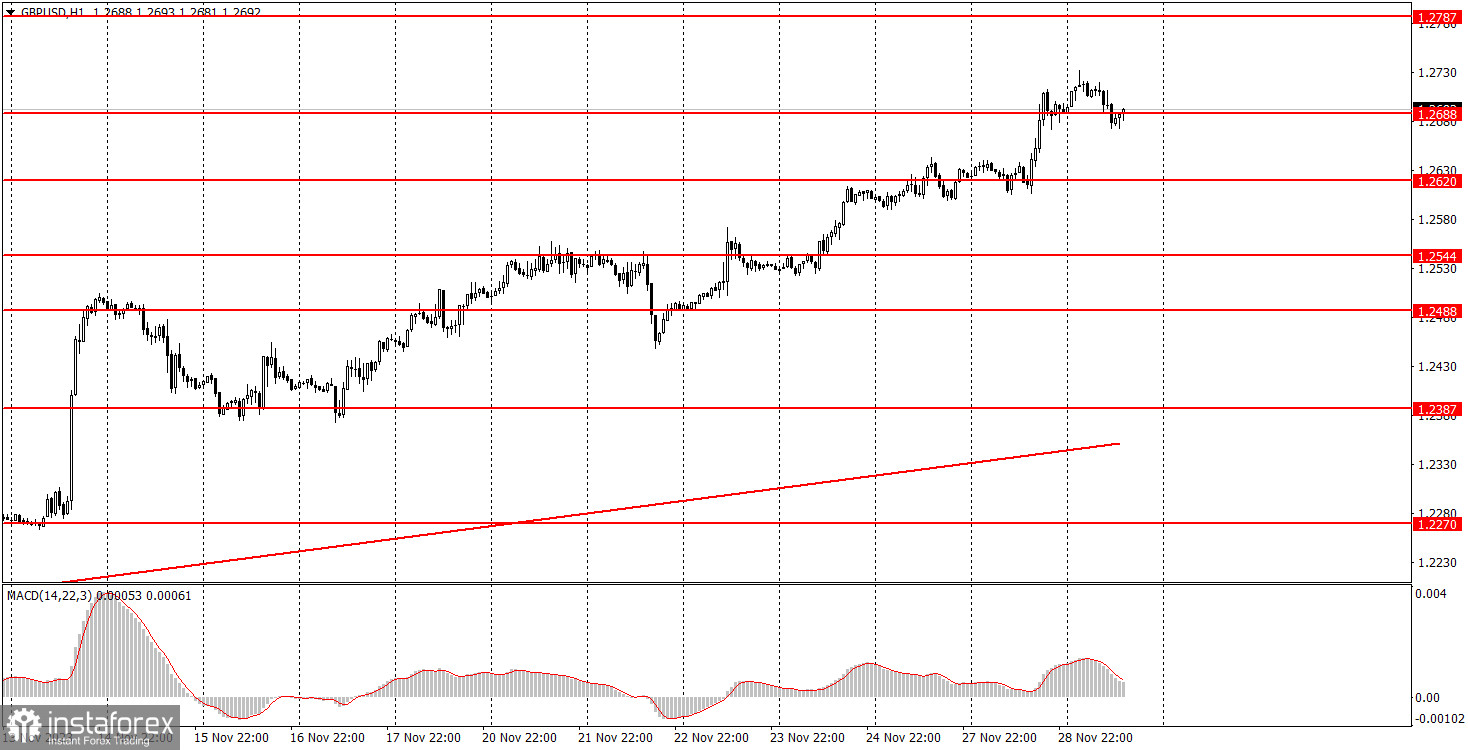
The GBP/USD pair, at the end of the second trading day of the week, continued its upward movement. This time, the price surpassed the level of 1.2688, where it successfully consolidated. In principle, in each subsequent article, we can repeat the same thing: the rise of the British currency in recent weeks is unfounded. This does not negate the fact of growth and the possibility of working with it. We simply draw the attention of novice traders to the fact that there is currently no reason for the pound to appreciate and the dollar to fall. This means that the market is currently trading on "bare" technicals. Whether it's good or bad, it's not for us to judge. We only state the facts.
Since the current upward movement is unfounded, we expect it to come to an end. Unfortunately, it may take quite a while before the market begins to restore a fair exchange rate. Look at how far the trend line is located. Even if the price drops by 400 points in the coming days, the upward trend will still be preserved. The upward movement is almost without a rollback.
5M chart of the GBP/USD pair.
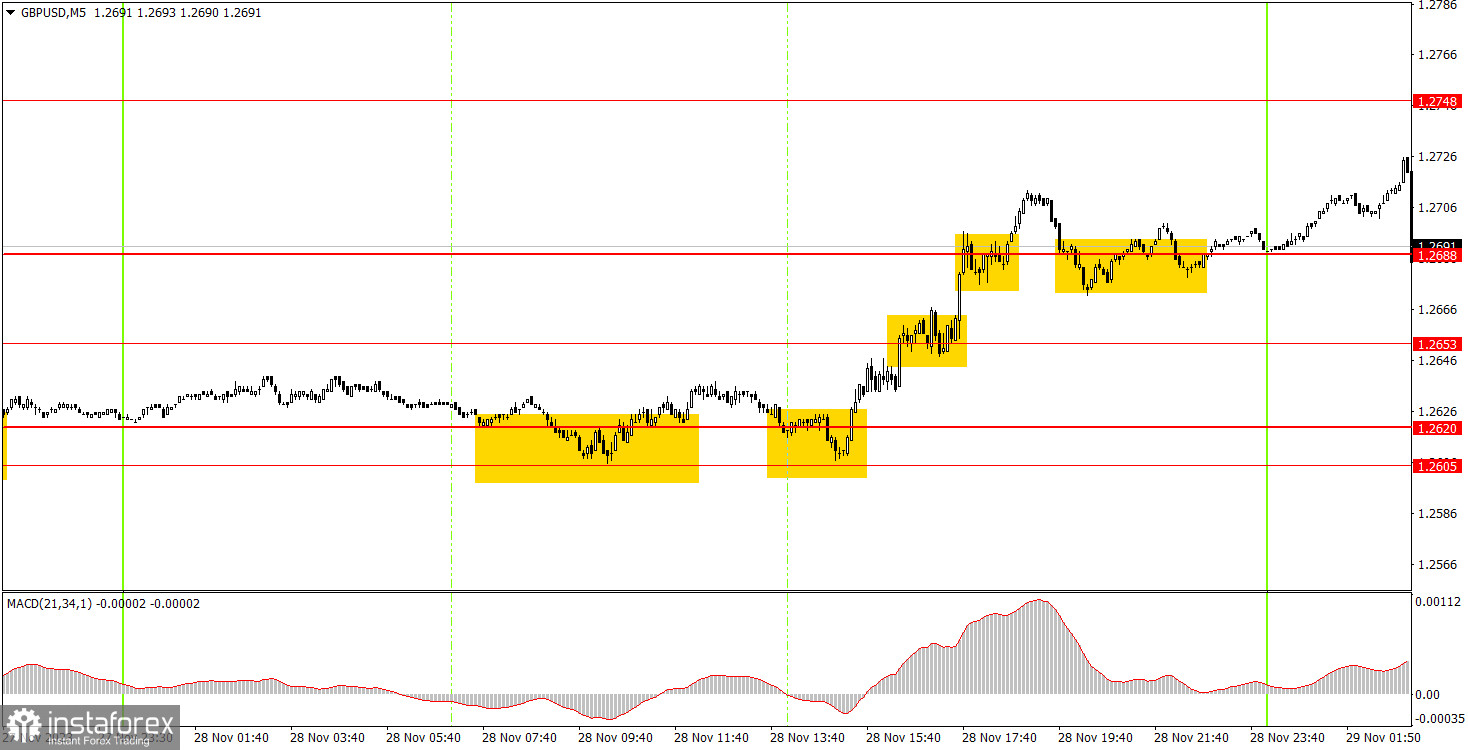
On Tuesday, in the 5-minute timeframe, several good trading signals were formed. Initially, the price rebounded twice from the area of 1.2605–1.2620, triggering a rise above the level of 1.2688. Novice players could open a long position based on these signals, but it was necessary to close it when the first sell signal was formed. Such a signal was generated when the price consolidated below the level of 1.2688. The total profit for the deal was about 40 points.
How to trade on Wednesday:
In the hourly timeframe, the GBP/USD pair continues to be in an upward trend, but we still believe that it will end soon. Currently, we have an upward trendline, the overcoming of which will allow us to determine the end of the upward trend. However, it is located quite far from the price. Therefore, practically any decline in the pair will still maintain the upward trend. Unfortunately, the movement is extremely strange now. On the 5-minute timeframe, you can trade tomorrow based on the levels 1.2270, 1.2310, 1.2372-1.2387, 1.2457-1.2488, 1.2544, 1.2605-1.2620, 1.2653, 1.2688, 1.2748, 1.2787-1.2791, and 1.2848-1.2860. When the price moves 20 points in the right direction after opening a trade, you can set the stop loss to break even. On Wednesday, there are no important events planned in the UK, and in the US, the report on GDP in the third estimate will be released (in fact, in half an hour). If the value of the report turns out to be unexpected, one should expect a market reaction.
Key Rules of the Trading System:
What's on the Chart:
Price levels of support and resistance – levels that are the targets when opening buy or sell positions. Take Profit levels can be placed near them.
Red lines – channels or trendlines that reflect the current trend and show the preferred direction to trade.
MACD Indicator (14, 22, 3) – histogram and signal line – an auxiliary indicator that can also be used as a source of signals.
Important speeches and reports (always contained in the news calendar) can significantly impact the movement of the currency pair. Therefore, during their release, it is recommended to trade with maximum caution or exit the market to avoid a sharp reversal of the price against the previous movement.
For beginners trading in the forex market, it is essential to remember that not every trade can be profitable. Developing a clear strategy and money management are the keys to success in long-term trading.
InstaForex analytical reviews will make you fully aware of market trends! Being an InstaForex client, you are provided with a large number of free services for efficient trading.

