 Stay
Stay 
Trading Conditions
Products
Tools


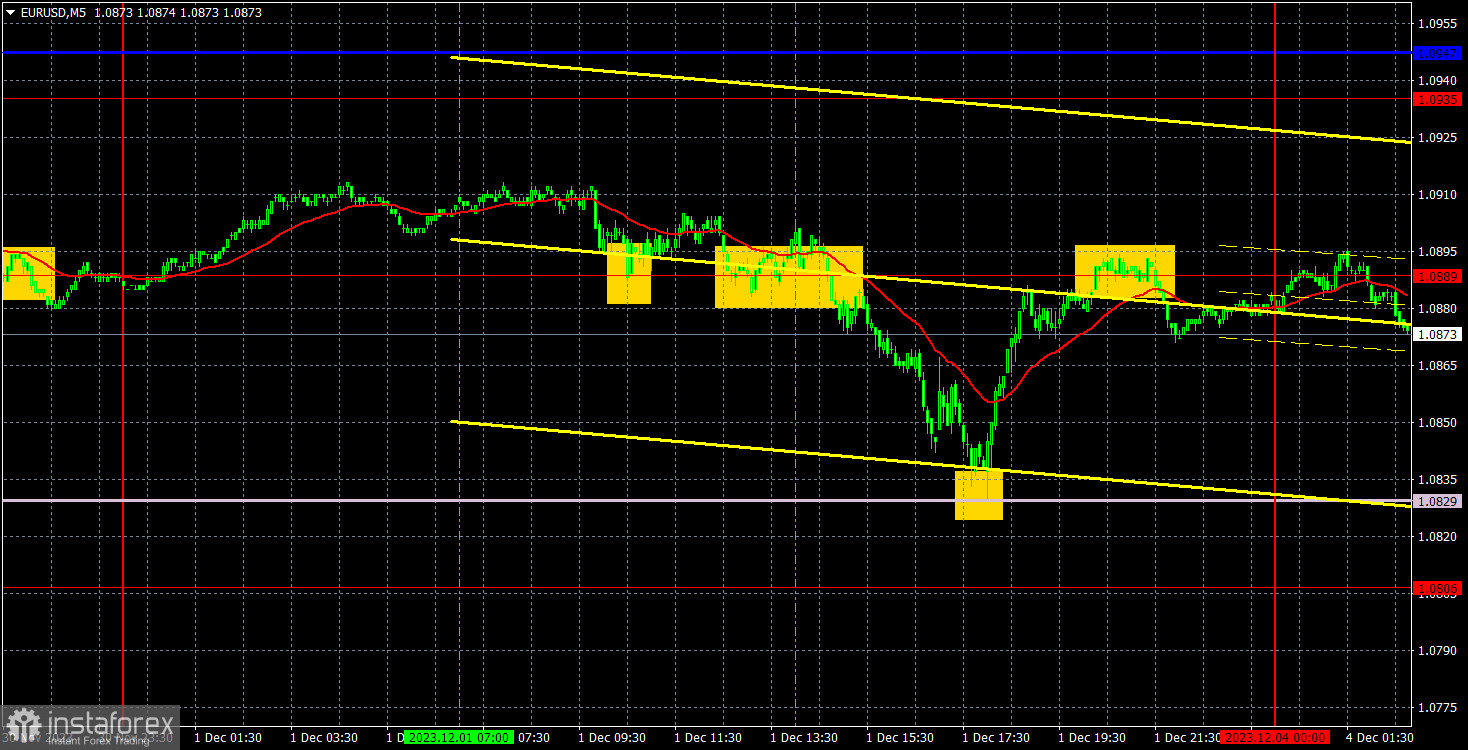
EUR/USD continued to trade lower on Friday, but unfortunately, it was quite brief. During the European session, the price stood still, remaining flat. In the U.S. session, the pair became more active, and the dollar began to rise, which, as a reminder, is in line with our expectations. However, this did not last long. Closer to the evening, the U.S. ISM report on business activity in the manufacturing sector for November was published. The indicator remained unchanged, although the markets expected a slight increase. Therefore, this was another U.S. report, which, if it did not turn out to be a total disappointment, was weaker than expectations. Therefore, closer to the evening, the dollar started to become weaker again. It was not possible to consolidate below the important Senkou Span B line.
Speaking of trading signals, most of them were good. The first buy signal in the form of a rebound from the level of 1.0889 turned out to be a false signal, and it was not even possible to set the Stop Loss at breakeven. But the next sell signal near the same level was much stronger, and the price managed to drop to the Senkou Span B line. A rebound from this line meant that we had to close short positions and open long ones. Before the market closed, the price managed to return to the level of 1.0889, where it was necessary to close long positions. As a result, there were two profitable trades and one losing one.
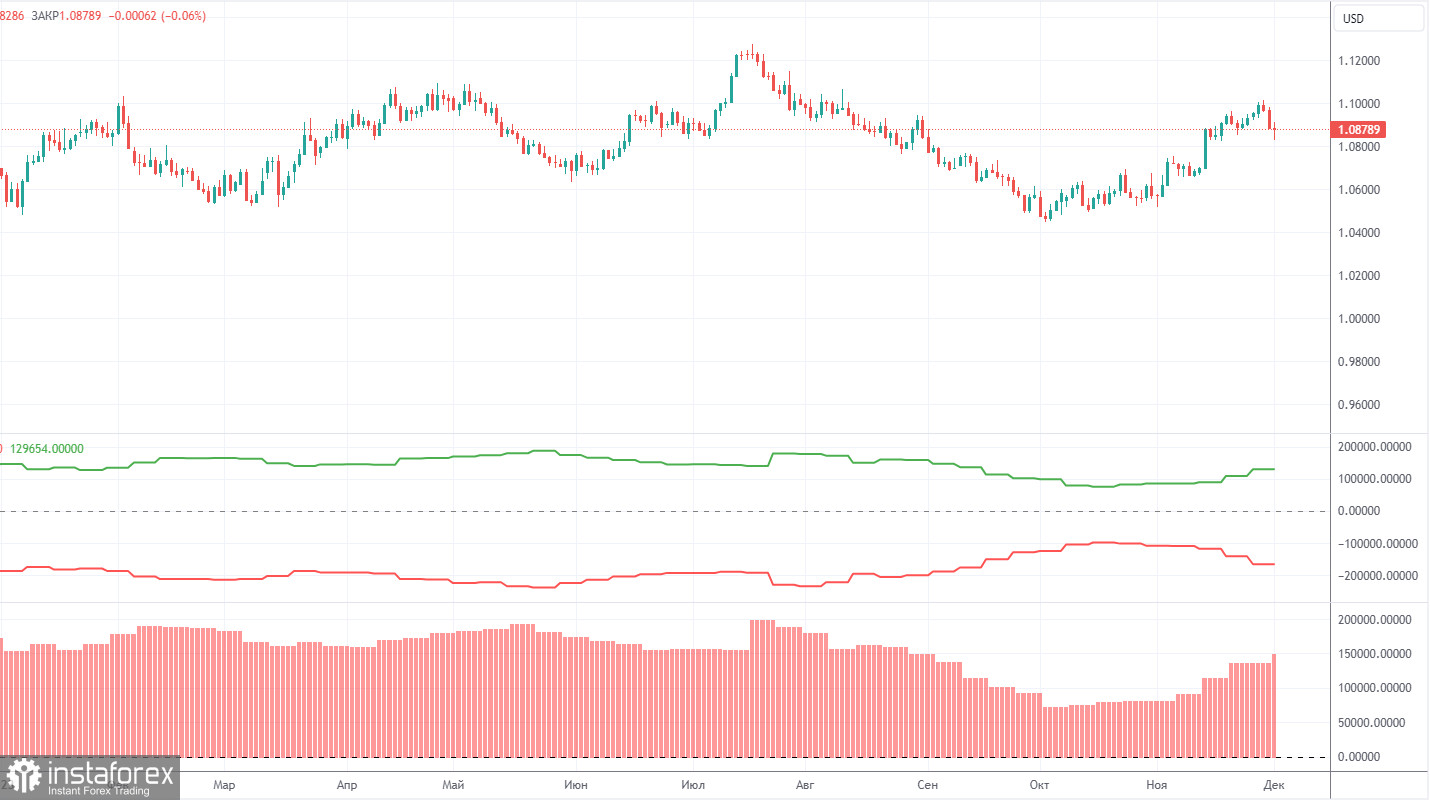
The latest COT report is dated November 28. Over the past 12 months, the COT report data has been consistent with what's happening in the market. The net position of large traders (the second indicator) began to rise back in September 2022, roughly at the same time that the euro started to rise. In the first half of 2023, the net position hardly increased, but the euro remained relatively high during this period. In the last three months, we have seen a decline in the euro and a drop in the net position, as we anticipated. However, in the last few weeks, both the euro and the net position have been rising. Therefore, we can draw a clear conclusion: the pair is correcting higher, and the corrective phase has not yet ended.
We have previously noted that the red and green lines have moved significantly apart from each other, which often precedes the end of a trend. Currently, after a small correction, these lines are diverging again. Therefore, we stick to the scenario that the upward trend should come to an end. During the last reporting week, the number of long positions for the "non-commercial" group increased by 2,300, while the number of short positions fell by 11,100. Consequently, the net position increased by 13,400. The number of BUY contracts is still higher than the number of SELL contracts among non-commercial traders by 143,000. In principle, it is now evident even without COT reports that the euro should continue to fall. However, the corrective phase has not yet ended.
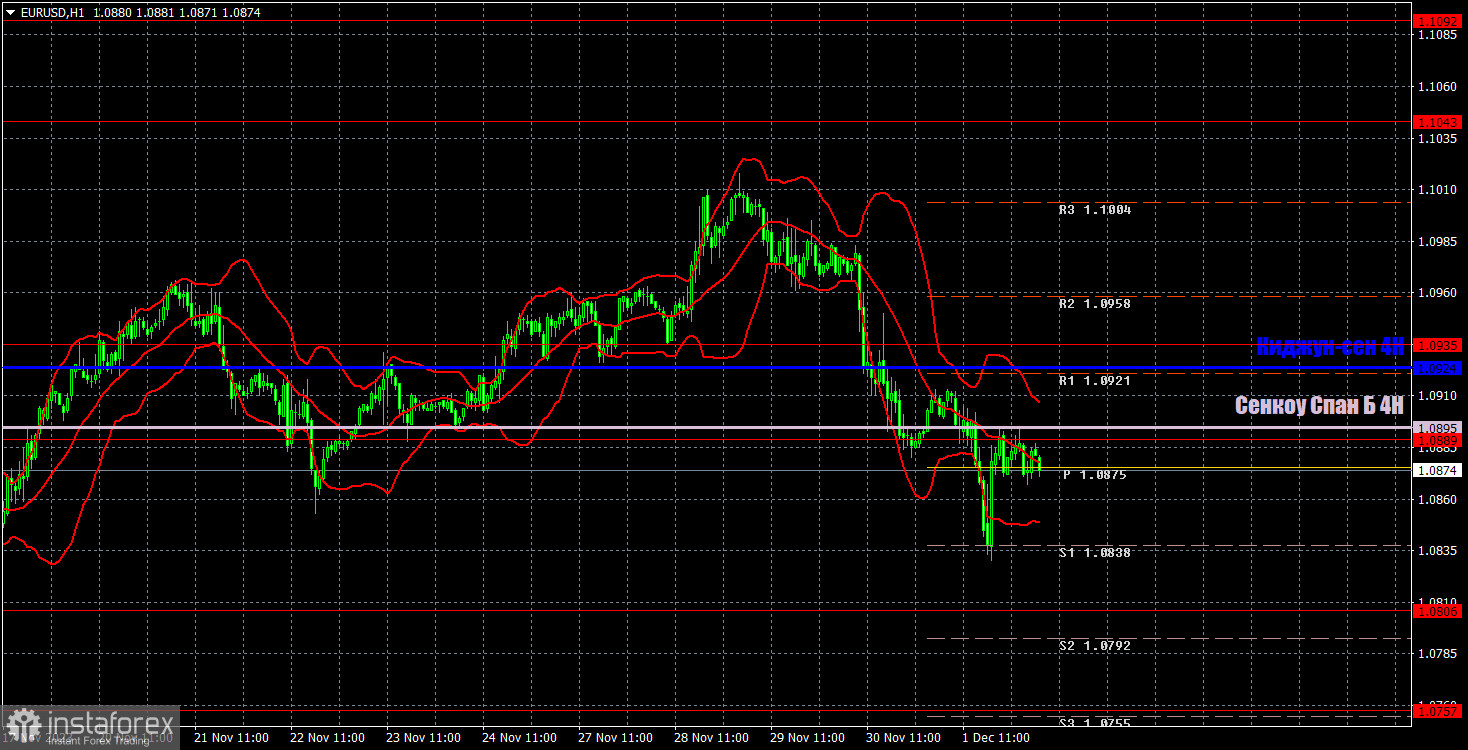
On the 1-hour chart, the pair has finally started to decline and has even breached the Ichimoku indicator lines. Therefore, the most logical scenario would be for the pair to drop further, which we have been expecting for several weeks now. On Monday, you should focus on the Senkou Span B lines and the level of 1.0889. A rebound from these lines is highly probable, making it possible to open new short positions with 1.0806 as the target. If you are to consider long positions today, it would be advisable to do so when we have confirmed that the pair is above the Kijun-sen line and the level of 1.0935.
On December 4, we highlight the following levels for trading: 1.0530, 1.0581, 1.0658-1.0669, 1.0757, 1.0806, 1,0889, 1.0935, 1.1043, 1.1092, 1.1137, as well as the Senkou Span B line (1.0895) and Kijun-sen line (1.0924) lines. The Ichimoku indicator lines can shift during the day, so this should be taken into account when identifying trading signals. There are also auxiliary support and resistance levels, but signals are not formed near them. Signals can be "bounces" and "breakouts" of extreme levels and lines. Don't forget to set a breakeven Stop Loss if the price has moved in the right direction by 15 pips. This will protect against potential losses if the signal turns out to be false.
On Monday, European Central Bank President Christine Lagarde, as well as her deputy Luis de Guindos will speak. Although we do not expect any significant statements, there's still a chance that they may share important information, especially given that the latest eurozone inflation data was just released, which could influence the central bank's stance in the near future.
Support and resistance levels are thick red lines near which the trend may end. They do not provide trading signals;
The Kijun-sen and Senkou Span B lines are the lines of the Ichimoku indicator, plotted to the 1H timeframe from the 4H one. They provide trading signals;
Extreme levels are thin red lines from which the price bounced earlier. They provide trading signals;
Yellow lines are trend lines, trend channels, and any other technical patterns;
Indicator 1 on the COT charts is the net position size for each category of traders;
Indicator 2 on the COT charts is the net position size for the Non-commercial group.
InstaForex analytical reviews will make you fully aware of market trends! Being an InstaForex client, you are provided with a large number of free services for efficient trading.


