 Stay
Stay 
Trading Conditions
Products
Tools


EUR/USD shows additional bearish bias on Tuesday, in full accordance with our expectations. The euro's decline was not exactly strong, but at least it still fell. We have already expected such a development in recent weeks. The single currency rose too high while undergoing a corrective phase and turned out to be significantly overbought, with only a few weak U.S. reports to justify such growth. However, yesterday, not only did the pair have a technical reason to fall but it also had a fundamental one. European Central Bank Vice President Luis de Guindos suggested that there is no need to raise the key rate in the near future since inflation is falling at a good pace. In principle, we are already aware that there's an extremely low chance of another rate hike. The ECB was initially not as hawkish as the Federal Reserve and the Bank of England. And now, talking about a rate hike for the ECB is simply impractical.
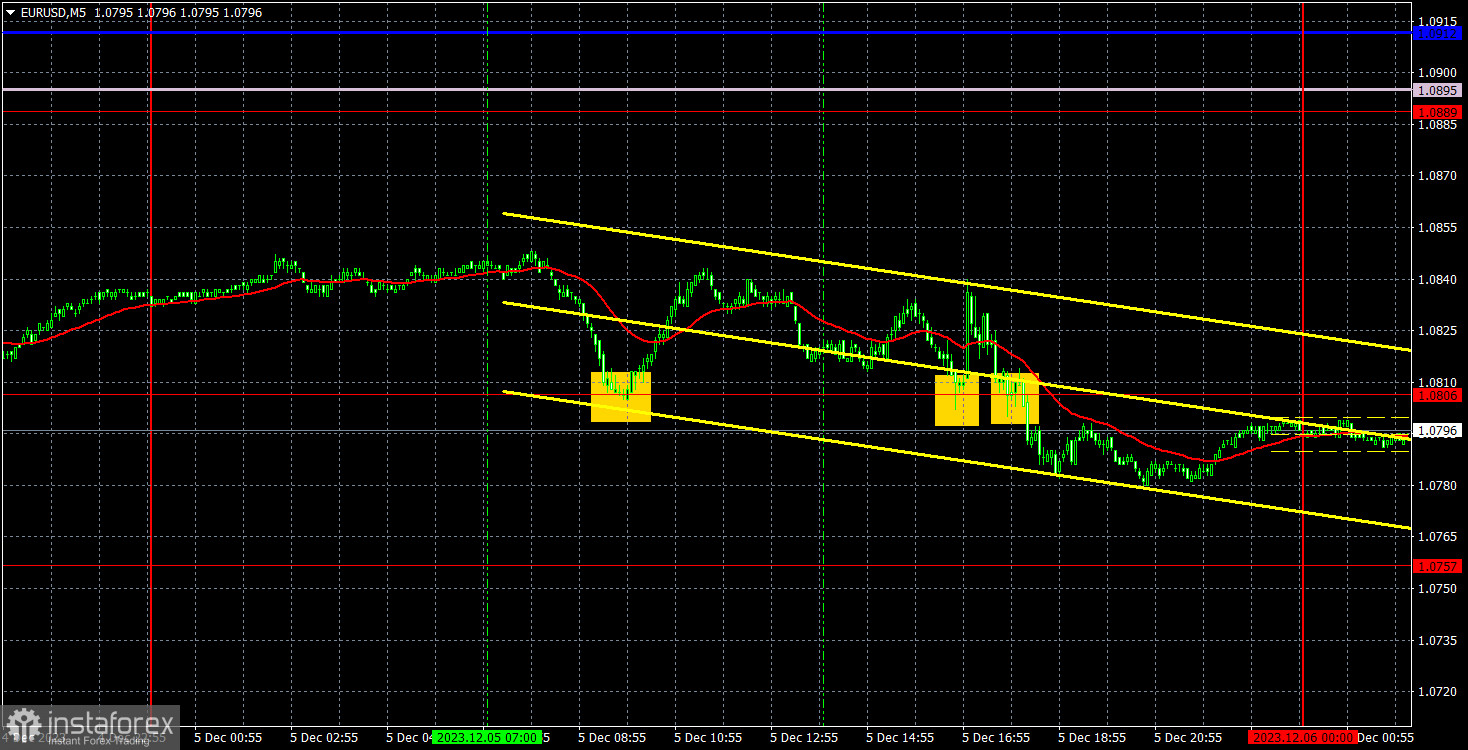
Several trading signals were generated yesterday. The price bounced twice from the level of 1.0806, but in both cases, this led to an increase of no more than 20 pips. Traders could set a stop-loss at break-even, but these did not bring profits. Closer to the end of the day, the pair settled below the level of 1.0806, but even this signal did not lead to a strong movement in the intended direction. Thus, the day turned out to be quite dull, although the signals themselves were clear and accurate.
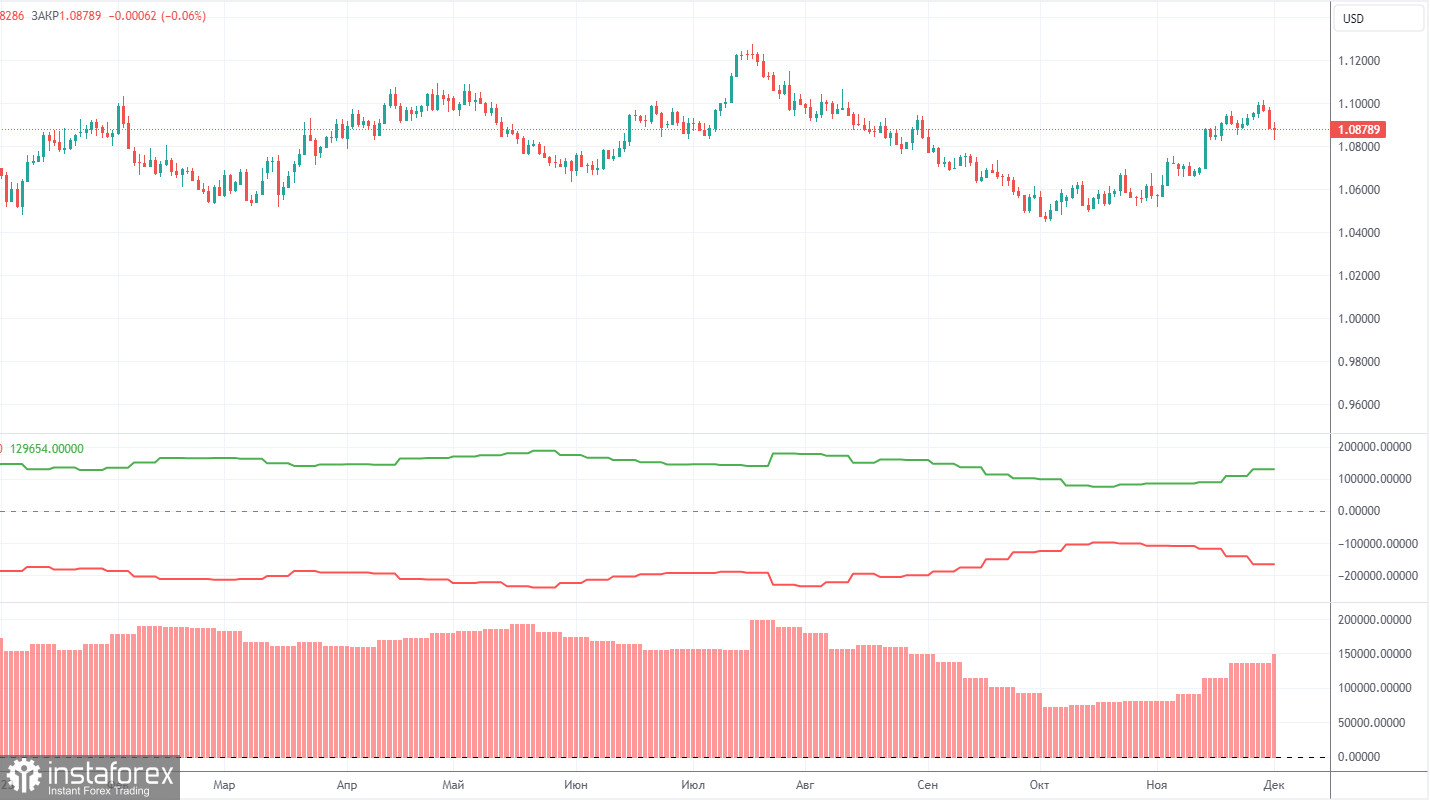
The latest COT report is dated November 28. Over the past 12 months, the COT report data has been consistent with what's happening in the market. The net position of large traders (the second indicator) began to rise back in September 2022, roughly at the same time that the euro started to rise. In the first half of 2023, the net position hardly increased, but the euro remained relatively high during this period. In the last three months, we have seen a decline in the euro and a drop in the net position, as we anticipated. However, in the last few weeks, both the euro and the net position have been rising. Therefore, we can draw a clear conclusion: the pair is correcting higher, and the corrective phase has not yet ended.
We have previously noted that the red and green lines have moved significantly apart from each other, which often precedes the end of a trend. Currently, after a small correction, these lines are diverging again. Therefore, we stick to the scenario that the upward trend should come to an end. During the last reporting week, the number of long positions for the "non-commercial" group increased by 2,300, while the number of short positions fell by 11,100. Consequently, the net position increased by 13,400. The number of BUY contracts is still higher than the number of SELL contracts among non-commercial traders by 143,000. In principle, it is now evident even without COT reports that the euro should continue to fall. However, the corrective phase has not yet ended.
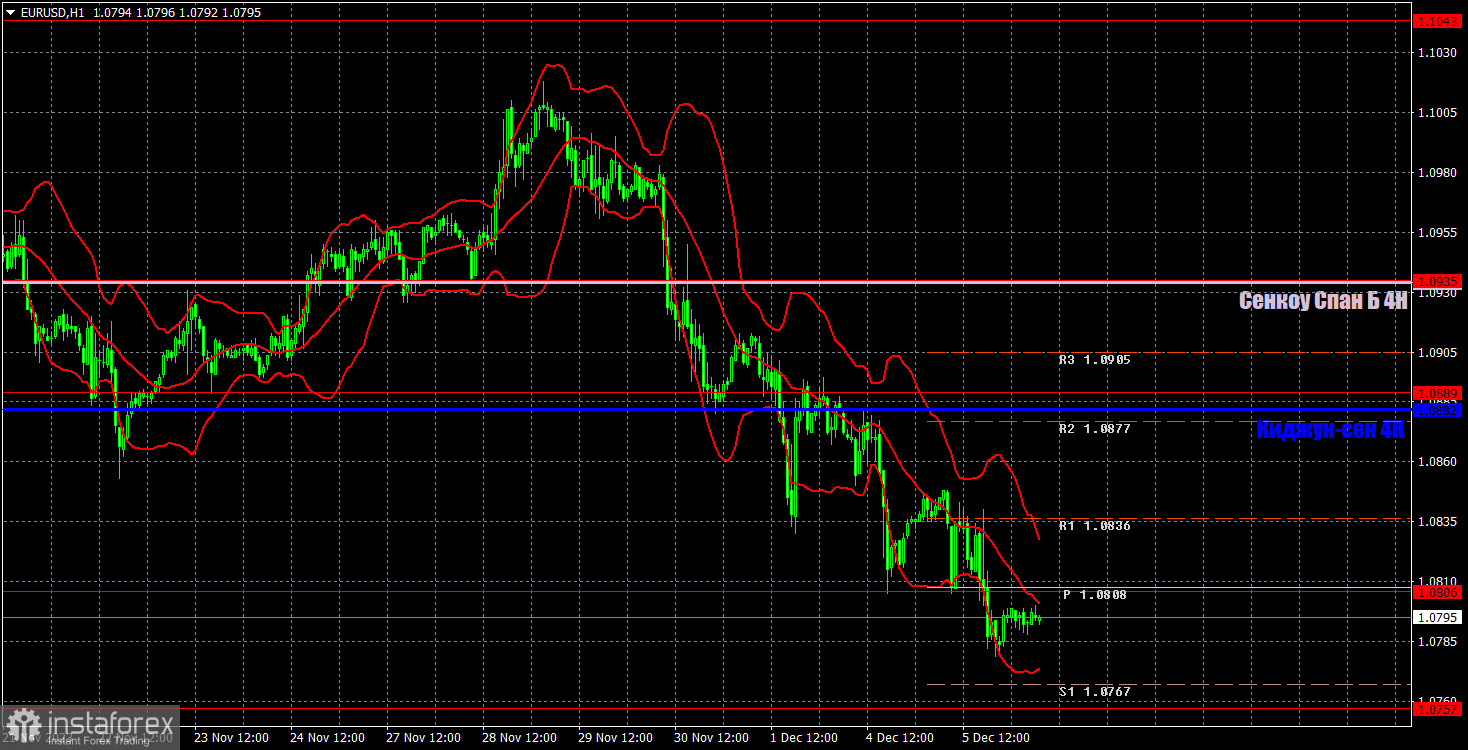
On the 1-hour chart, the pair has finally started to decline and has even breached the Ichimoku indicator lines. Therefore, the most logical scenario now would be for the pair to drop further. The euro is falling almost every day, paying little attention to the U.S. reports that elevated it to the pedestal. And this is a good thing – it means the market has started to rectify the situation.
At the moment, we advise you to continue with selling. Of course, by the end of the week, there will be more U.S. reports that could trigger the dollar's decline. However, in the current circumstances, a more probable scenario would be for the euro to fall and the dollar to rise.
On December 6, we highlight the following levels for trading: 1.0530, 1.0581, 1.0658-1.0669, 1.0757, 1.0806, 1.0889, 1.0935, 1.1043, 1.1092, 1.1137, as well as the Senkou Span B (1.0935) and Kijun-sen (1.0882) lines. The Ichimoku indicator lines can shift during the day, so this should be taken into account when identifying trading signals. There are also auxiliary support and resistance levels, but signals are not formed near them. Signals can be "bounces" and "breakouts" of extreme levels and lines. Don't forget to set a breakeven Stop Loss if the price has moved in the right direction by 15 pips. This will protect against potential losses if the signal turns out to be false.
On Wednesday, investors await the Eurozone Retail Sales and US ADP private employment data. Both reports are expected to have a limited impact on the pair's movement. Nevertheless, we expect the euro to continue its downward movement.
Support and resistance levels are thick red lines near which the trend may end. They do not provide trading signals;
The Kijun-sen and Senkou Span B lines are the lines of the Ichimoku indicator, plotted to the 1H timeframe from the 4H one. They provide trading signals;
Extreme levels are thin red lines from which the price bounced earlier. They provide trading signals;
Yellow lines are trend lines, trend channels, and any other technical patterns;
Indicator 1 on the COT charts is the net position size for each category of traders;
Indicator 2 on the COT charts is the net position size for the Non-commercial group.
InstaForex analytical reviews will make you fully aware of market trends! Being an InstaForex client, you are provided with a large number of free services for efficient trading.


