empty
 
 
You are about to leave
www.instaforex.eu >
a website operated by
INSTANT TRADING EU LTD
Open Account

12.09.202408:22 Forex Analysis & Reviews: USD/CHF: outlook on September 12

Long-term review
This information is provided to retail and professional clients as part of marketing communication. It does not contain and should not be construed as containing investment advice or investment recommendation or an offer or solicitation to engage in any transaction or strategy in financial instruments. Past performance is not a guarantee or prediction of future performance. Instant Trading EU Ltd. makes no representation and assumes no liability as to the accuracy or completeness of the information provided, or any loss arising from any investment based on analysis, forecast or other information provided by an employee of the Company or otherwise. Full disclaimer is available here.

Exchange Rates 12.09.2024 analysis
H4

As for the four-hour time frame, reaching the daily POI is somewhat far away. So, it is possible to take buy positions due to the presence of good signs of decline. The currency pair may rise due to the sweep of liquidity that occurred at the 0.83985 level to break the current peak, and fall to rebound from the 0.84600 order block.

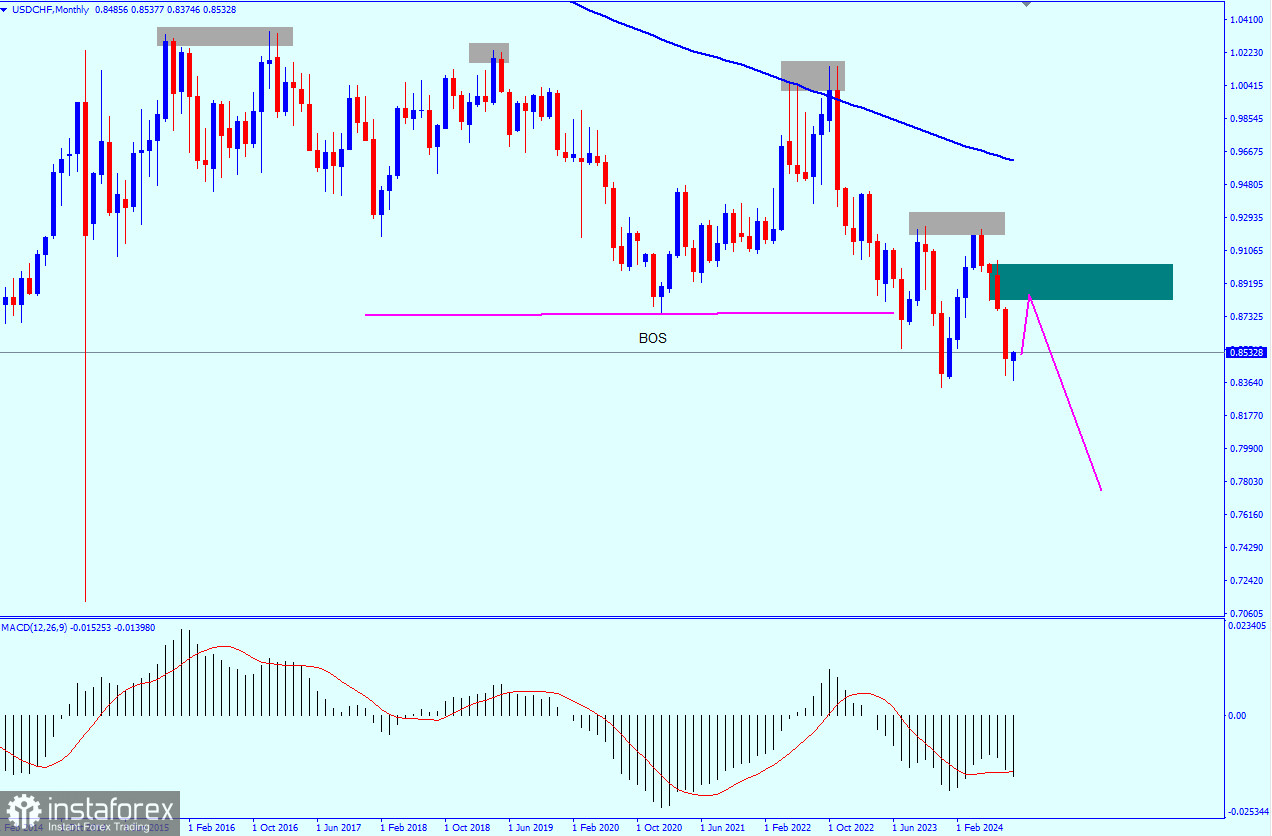
Points of interest (POI)

Buy from: 0.84600 (after breaking the current high at 0.85377)

TP 1: 0.85377 (first structure point)

TP 2: 0.8748 (daily structure)

Stop loss: 0.84200 (below the OB & the OF too)

Monthly chart

The USD/CHF pair has made lower lows. It is expected to continue this downtrend on the monthly time frame as there is no signal for the pair to break the previous high. The instrument may rebound from the level of 0.88225, Besides, the presence of the 200 moving average above this level supports the decline.

Weekly chart

The weekly time frame also supports the decline due to the presence of the IDM before the order block, which coincides with the monthly order, but it is better to wait for a weekly candle to close within the order block range.

Daily chart

Almost the same thing is detected in the daily time frame, but the picture has become clearer, as the moving average 200 is very close to the order block, which supports the decline. There is also an IDM in the daily chart, where it is possible to open sell orders at the order block, where the moving average is located.

Amir Anwar
Analytical expert of InstaForex
© 2007-2024

Open trading account

InstaForex analytical reviews will make you fully aware of market trends! Being an InstaForex client, you are provided with a large number of free services for efficient trading.


You are now leaving www.instaforex.eu, a website operated by INSTANT TRADING EU LTD
Can't speak right now?
Ask your question in the chat.

Turn "Do Not Track" off