 Stay
Stay 
Trading Conditions
Products
Tools


GBP/USD also didn't show any interesting movements on Friday. The volatility was a mere 44 pips, indicating an absence of significant movements. Even the unscheduled report on US inflation for December in monthly terms couldn't salvage the situation. The dollar fell by 20 pips after this report, which concluded the day's movements. Overall, the British pound continues to correct higher after a two-day significant decline.
There were almost no notable fundamental and macroeconomic events last week. Just a couple of secondary reports and a few speeches by Federal Reserve representatives, the essence of which boiled down to the central bank not being in a rush to lower the key interest rate and will carefully monitor key macroeconomic indicators. As one might guess, the market did not react to this information.
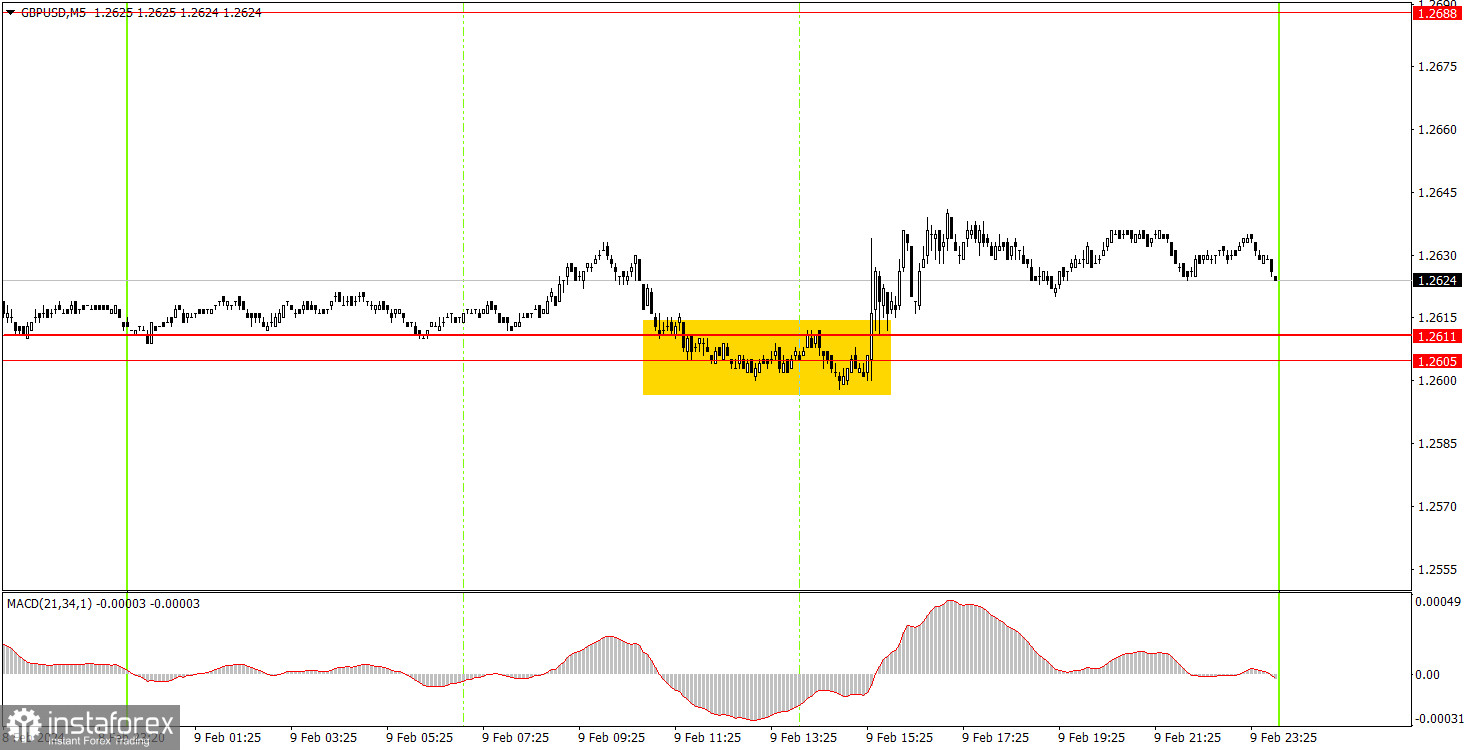
The movements on the 5-minute timeframe were weak once again. It is difficult to rely on good signals and high profits when a currency pair shows weak movements. The pair formed only one buy signal. It was quite inaccurate, but still, beginners could open long positions at the beginning of the US session. After this signal was formed, the price went up by no more than 10 pips, and it failed to show any downward movement. Thus, this trade could be manually closed at a minimal profit.
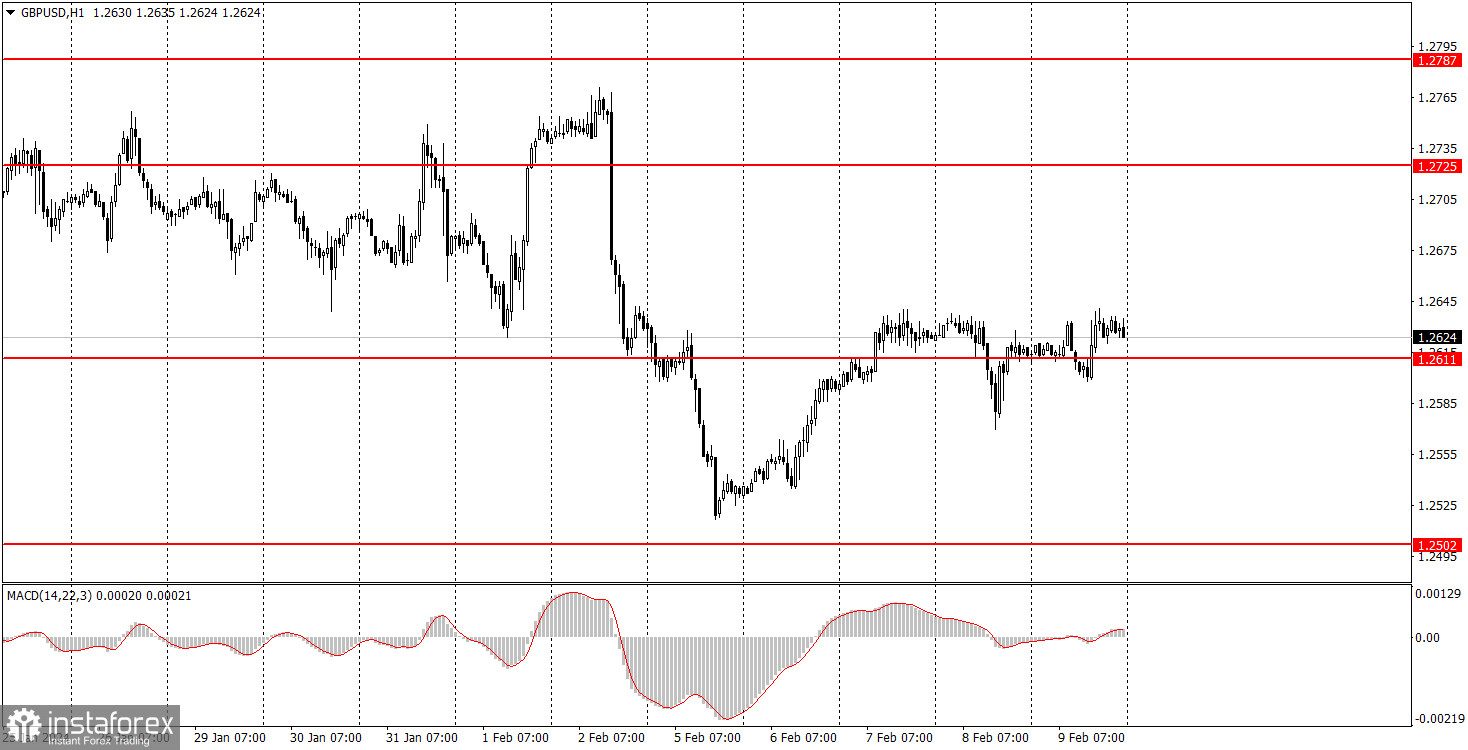
On the hourly chart, GBP/USD left the sideways channel of 1.2611-1.2787 but has already returned to it. The fundamental and macroeconomic background has been very weak, so we have seen corresponding movements in the pair. It is important to revive the downtrend. Otherwise, we should prepare for new chaotic movements within a limited price range.
The key levels on the 5M chart are 1.2270, 1.2310, 1.2372-1.2387, 1.2457, 1.2502, 1.2544, 1.2605-1.2611, 1.2688, 1.2725, 1.2787-1.2791, 1.2848-1.2860, 1.2913, 1.2981-1.2993. No scheduled reports or events in the US. We can only highlight Bank of England Governor Andrew Bailey's speech, which could be interesting. If his rhetoric softens slightly compared to what was shown during the BoE meeting, the British pound may fall.
1) Signal strength is determined by the time taken for its formation (either a bounce or level breach). A shorter formation time indicates a stronger signal.
2) If two or more trades around a certain level are initiated based on false signals, subsequent signals from that level should be disregarded.
3) In a flat market, any currency pair can produce multiple false signals or none at all. In any case, the flat trend is not the best condition for trading.
4) Trading activities are confined between the onset of the European session and mid-way through the U.S. session, after which all open trades should be manually closed.
5) On the 30-minute timeframe, trades based on MACD signals are only advisable amidst substantial volatility and an established trend, confirmed either by a trendline or trend channel.
6) If two levels lie closely together (ranging from 5 to 15 pips apart), they should be considered as a support or resistance zone.
Support and Resistance price levels can serve as targets when buying or selling. You can place Take Profit levels near them.
Red lines represent channels or trend lines, depicting the current market trend and indicating the preferable trading direction.
The MACD(14,22,3) indicator, encompassing both the histogram and signal line, acts as an auxiliary tool and can also be used as a signal source.
Significant speeches and reports (always noted in the news calendar) can profoundly influence the price dynamics. Hence, trading during their release calls for heightened caution. It may be reasonable to exit the market to prevent abrupt price reversals against the prevailing trend.
Beginners should always remember that not every trade will yield profit. Establishing a clear strategy coupled with sound money management is the cornerstone of sustained trading success.
InstaForex analytical reviews will make you fully aware of market trends! Being an InstaForex client, you are provided with a large number of free services for efficient trading.

