 Stay
Stay 
Trading Conditions
Products
Tools


The pound has generally been standing still for a week, but today, traders and investors may become more active. The day will likely start with the UK unemployment data putting pressure on the British currency. Market players expect a dip in unemployment from 3.9% to 4.0%. Perhaps the pound might even fall slightly below the lower boundary of the current range. However, once the US trading session opens, it will not only climb to the upper boundary of the range but will also rise further. And this could be due to the US inflation data. According to forecasts, the growth rate of consumer prices is expected to slow down from 3.4% to 3.1%. In turn, this will revive expectations of an imminent rate cut from the Federal Reserve. Moreover, by "imminent," it is almost implied that spring is approaching. Furthermore, the mere fact that inflation is slowing down is reason enough for the dollar to weaken. Any change in expectations regarding the Fed's actions will only intensify this process.
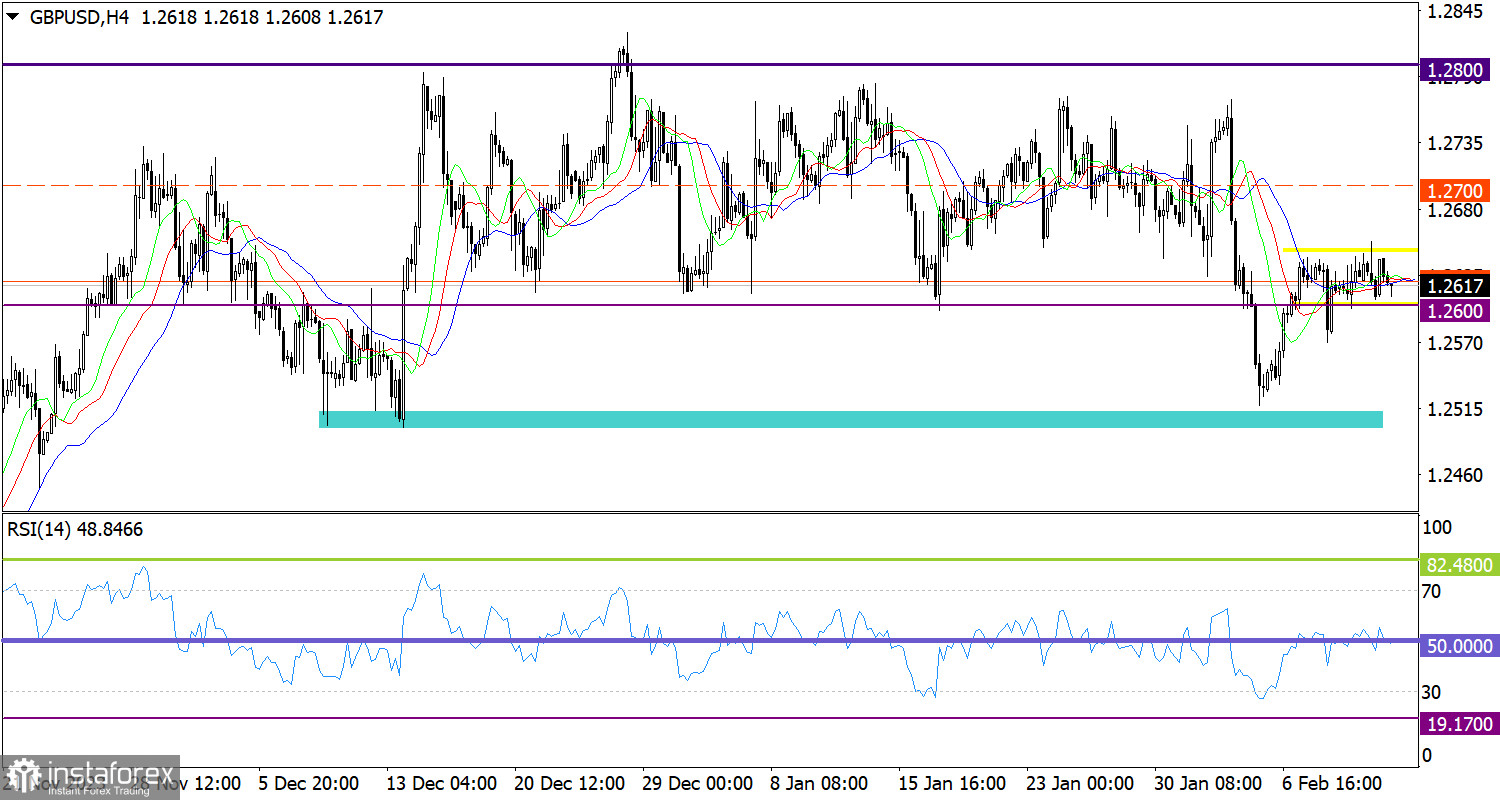
The flat phase has led to fluctuations along the 1.2600 level, indicating typical uncertainty in the subsequent movement.
On the four-hour chart, the RSI technical indicator is hovering along the 50 midline, which confirms the flat phase.
Meanwhile, the Alligator's MAs are intertwined in the 4-hour chart, another confirmation of a flat market.
Based on the current price fluctuations, we can assume that the flat phase may be classified as a process of the balance of trading forces. Traders may focus on the boundaries of 1.2600/1.2650.
The complex indicator analysis points to a flat phase in the short-term and intraday periods.
InstaForex analytical reviews will make you fully aware of market trends! Being an InstaForex client, you are provided with a large number of free services for efficient trading.


