 Stay
Stay 
Trading Conditions
Products
Tools


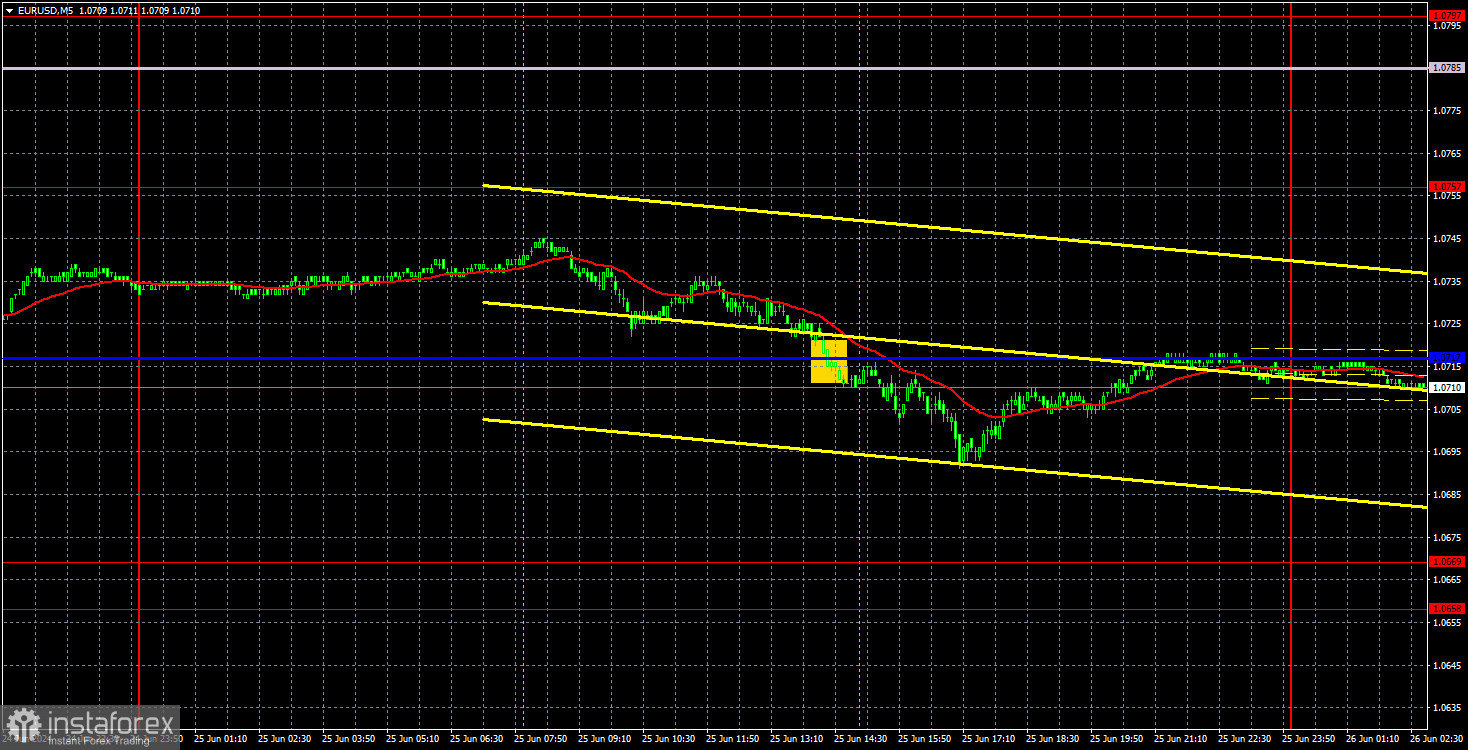
EUR/USD showed a weak downward movement on Tuesday, which was not triggered by any fundamental or macroeconomic event. Upon closer inspection, it's clear that since June 13-14, the price has been in a sideways channel between the levels of 1.0669 and 1.0757. Thus, we have a sideways channel about 90 pips wide. Take note that the presence of a sideways channel does not imply that the price will constantly reach the upper and lower boundaries. The price will move between these boundaries until it leaves the channel. However, this does not mean that these boundaries will be regularly tested. Nevertheless, traders can consider long positions near the lower boundary and short positions near the upper boundary.
As mentioned, there were no significant reports or any events yesterday. The price rose on Monday, and it decided to fall on Tuesday, consistent with the nature of movement within a flat. We expect the pair to fall in the medium term, and we have warned traders that the corrective phase could last a couple of weeks.
Speaking of trading signals, the pair only formed one signal on Tuesday. The price consolidated below the Kijun-sen line before the start of the US trading session, prompting a 20-pip decline. It was difficult to expect a stronger movement given the low volatility.
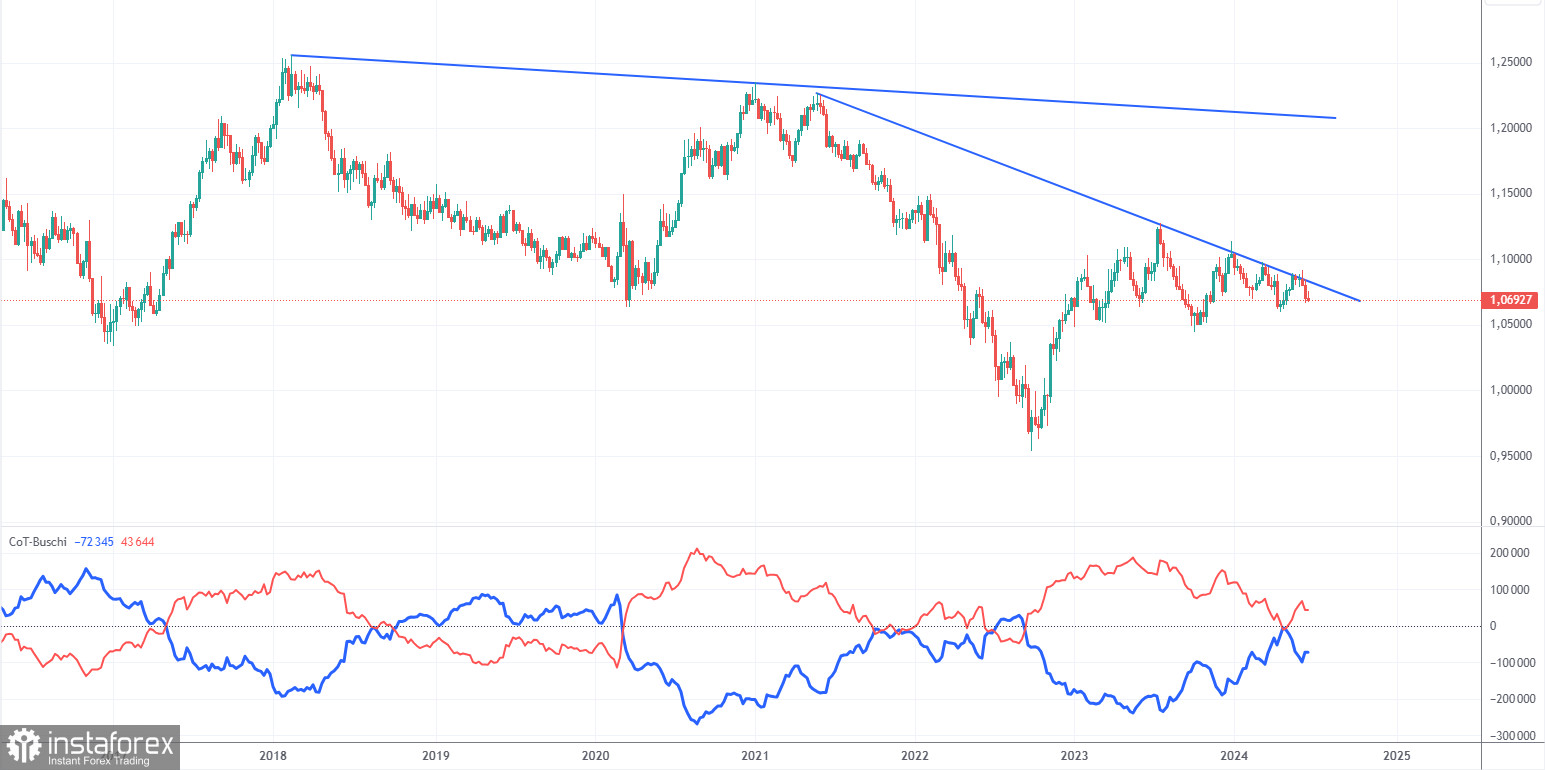
The latest COT report is dated June 11. The net position of non-commercial traders has remained bullish for quite some time, and we're still dealing with the same situation. The bears' attempt to gain dominance failed miserably. The net position of non-commercial traders (red line) has been declining in recent months, while that of commercial traders (blue line) has been growing. But now we're seeing the opposite trend once again. This shows that buyers, not sellers, are currently gaining momentum again. This might be temporary since the downward trend is still valid.
We don't see any fundamental factors that can support the euro's strength in the long term, while technical analysis also suggests a continuation of the downtrend. Three descending trend lines on the weekly chart suggests that there's a good chance of further decline.
The red and blue lines are currently moving away from each other again, which indicates a build-up in long positions on the euro. During the last reporting week, the number of long positions for the non-commercial group decreased by 1,200, while the number of short positions increased by 23,000. Accordingly, the net position decreased by 14,200. We may witness the start of increasing bearish pressure. According to the COT reports, the euro has a lot of potential to fall.
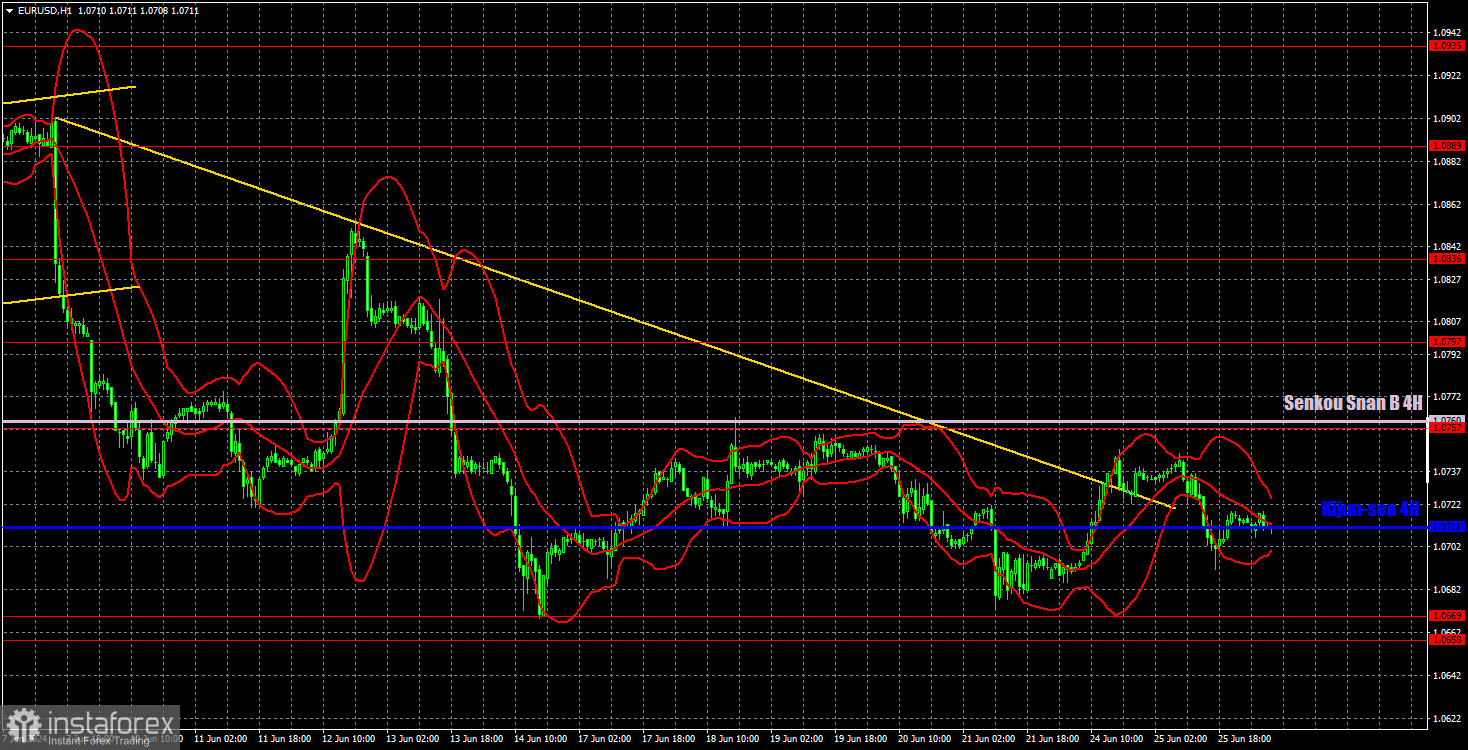
On the 1-hour chart, EUR/USD continues to form a new downtrend, which is part of the global trend. We still expect the single currency to fall, but the pair is currently going through a correction, and it may last for another week or two. Volatility has once again dropped to absolute lows, making it quite difficult to conduct analysis and trading. In any case sell signals are required for a new wave of the downtrend, and there are currently none of those.
On June 26, we highlight the following levels for trading: 1.0530, 1.0581, 1.0658-1.0669, 1.0757, 1.0797, 1.0836, 1.0889, 1.0935, 1.1006, 1.1092, as well as the Senkou Span B line (1.0760) and the Kijun-sen line (1.0711). The Ichimoku indicator lines can move during the day, so this should be taken into account when identifying trading signals. Don't forget to set a Stop Loss to breakeven if the price has moved in the intended direction by 15 pips. This will protect you against potential losses if the signal turns out to be false.
On Wednesday, no significant events are scheduled in either the US or the Eurozone. Germany will release the consumer expectations index, and the US docket will feature a report on new home sales. The pair will likely go through low volatility again, and the price will remain within the sideways channel.
Support and resistance levels are thick red lines near which the trend may end. They do not provide trading signals;
The Kijun-sen and Senkou Span B lines are the lines of the Ichimoku indicator, plotted to the 1H timeframe from the 4H one. They provide trading signals;
Extreme levels are thin red lines from which the price bounced earlier. They provide trading signals;
Yellow lines are trend lines, trend channels, and any other technical patterns;
Indicator 1 on the COT charts is the net position size for each category of traders;
InstaForex analytical reviews will make you fully aware of market trends! Being an InstaForex client, you are provided with a large number of free services for efficient trading.


