 Stay
Stay 
Trading Conditions
Products
Tools


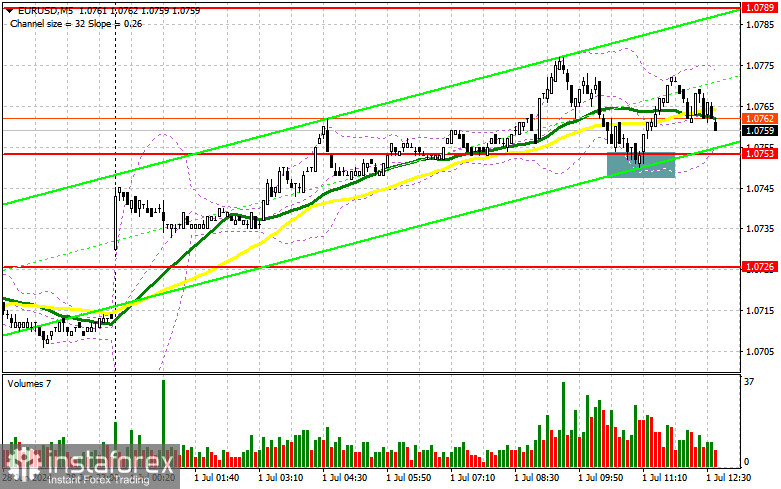
In my morning forecast, I focused on the 1.0753 level and planned to make market entry decisions based on it. Let's look at the 5-minute chart and see what happened there. The decline and formation of a false breakout at 1.0753 led to a buy signal, resulting in a 20-point rise in the pair, after which demand for the euro decreased. The technical outlook for the second half of the day has not been revised.
To Open Long Positions on EUR/USD:
The released data on manufacturing activity in the Eurozone for June of this year disappointed traders, reflected in the euro's exchange rate. The active growth phase up to around 50 points has ended, indicating ongoing issues in the manufacturing sector of many Eurozone countries. Without strong support and further interest rate cuts, the ECB will struggle, which is why the euro is declining. However, the active actions of bulls around the 1.0753 level, which will be the focus in the second half of the day, still preserve the chances for an intraday rise in EUR/USD. A decline and the formation of a false breakout at 1.0753, similar to what I discussed earlier, will be a suitable entry point for long positions to restore the euro to the area of 1.0789, which we have not yet reached today. A breakout and update from top to bottom of this range will strengthen the pair with a chance to rise to the resistance at 1.0816. The furthest target will be the maximum at 1.0852, where I will take profit. Testing this level will give buyers an advantage. In the case of EUR/USD decreasing and lack of activity around 1.0753 in the second half of the day (considering this level has already been worked out once today), the pressure on the pair will return. In such a case, I will only enter after forming a false breakout around the next support at 1.0726, where the moving averages are located. I plan to open long positions immediately on a rebound from 1.0695 with the aim of an upward correction of 30-35 points within the day.
To Open Short Positions on EURUSD:
Sellers have shown activity but have not yet managed to break below 1.0753, which will be their target for the second half of the day. Good statistics on the US ISM Manufacturing Index could help with this. In the event of a bullish market reaction to the data, defending the resistance at 1.0789 and a false breakout will provide a suitable entry point for short positions, aiming for another drop of the pair to the support at 1.0753. Only a breakout and consolidation below this range, amid strong statistics and a reverse test from bottom to top, will provide another point for selling, moving towards a minimum of 1.0726, where I expect to see more active bull responses. The furthest target will be the area of 1.0695, where I will take profit. In case of an upward movement of EUR/USD in the second half of the day and the absence of bears at 1.0789 (which cannot be ruled out due to the high likelihood of weak manufacturing activity in the US), buyers will be able to achieve further growth of the pair at the beginning of the month. In this case, I will delay sales until testing the next resistance at 1.0816. I will also sell there, but only after an unsuccessful consolidation. I plan to open short positions immediately on a rebound from 1.0852 with the aim of a downward correction of 30-35 points.
Indicator Signals:
Moving Averages
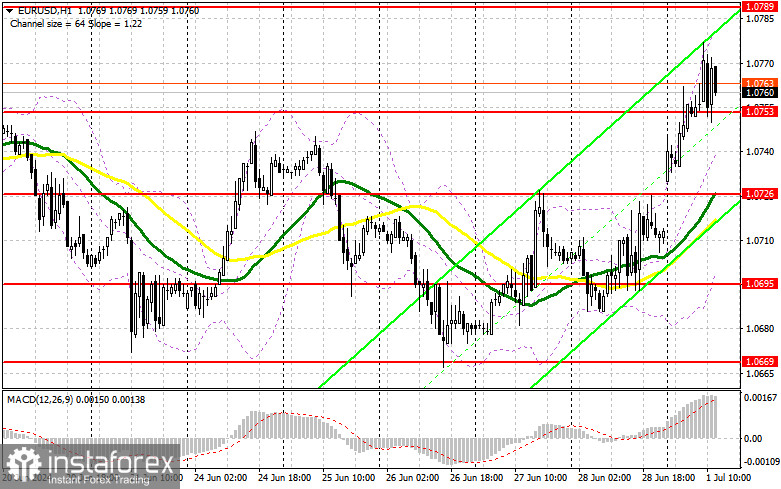
Trading is conducted above the 30 and 50-day moving averages, indicating further growth for the pair.
Note: The period and prices of the moving averages are considered by the author on the hourly H1 chart and differ from the general definition of classical daily moving averages on the daily D1 chart.
Bollinger Bands
In the event of a decline, the indicator's lower boundary, around 1.0700, will act as support.
Indicator Descriptions
InstaForex analytical reviews will make you fully aware of market trends! Being an InstaForex client, you are provided with a large number of free services for efficient trading.


