 Stay
Stay 
Trading Conditions
Products
Tools


EUR/USD traded in positive territory on Wednesday, which made sense. Yesterday, the US (and not just America) published a new batch of economic reports, which did not support the greenback. In particular, the two most important reports of the day – ISM in the services sector and ADP – showed values worse than the forecasts. Take note that we should focus on the value in comparison to the forecast, and not the previous result. That is why we saw the pair rise in the second half of the day and, accordingly, the US dollar fell.
To be honest, if US macro data continue to show such weak results, the market will have more grounds to buy and not sell the pair, as the global technical picture requires. Today, the US economic calendar is empty in observance of the Independence Day holiday, but tomorrow, crucial reports on NonFarm Payrolls and unemployment reports will be released. If they show weak values, the dollar will fall once again.
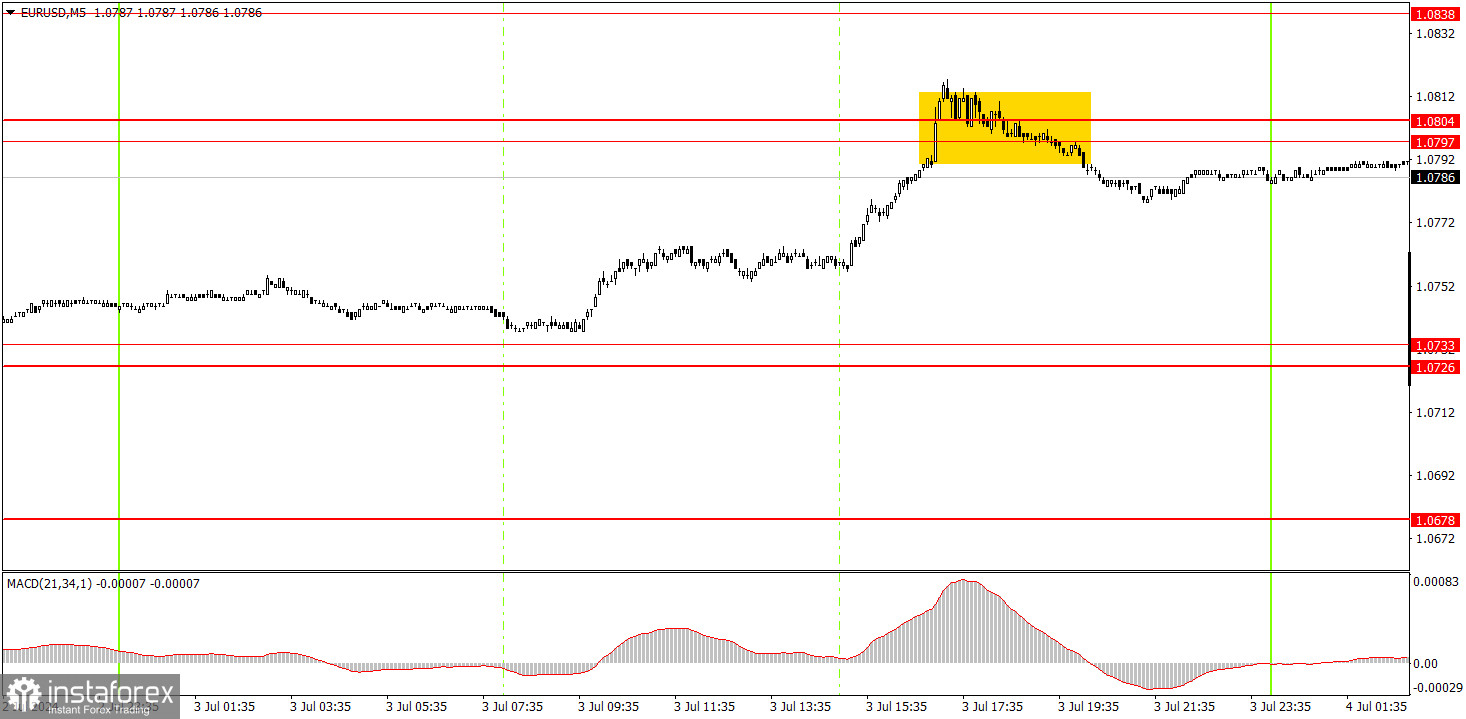
The pair formed only one trading signal on the 5-minute timeframe. At the very end of the day, the euro reached the area of 1.0797-1.0804 and bounced off it. Traders missed an excellent opportunity (unfortunately) at the very beginning of the European trading session when the price fell just a few pips short of the 1.0726-1.0733 area. It was possible to execute the sell signal, and today the pair could correct lower. However, volatility might be very low again.
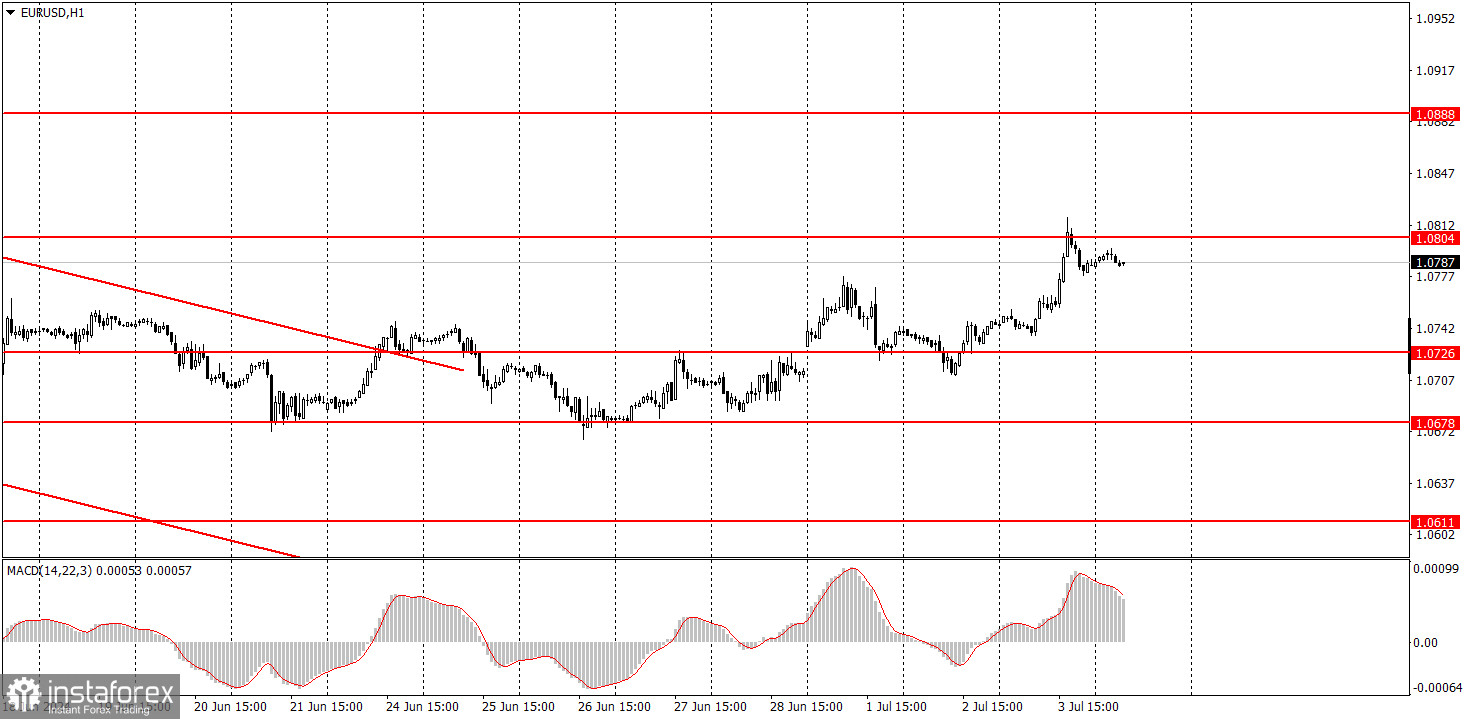
On the hourly chart, EUR/USD was unable to break through the 1.0678 level, and this week's economic reports have mostly supported the euro instead of the dollar. Therefore, the euro's rise was quite predictable. Due to this movement, the overall (downward) trend has not changed, but the euro has been frequently trading with strong corrections over the past 7-8 months. Formally, the euro is falling, as seen on higher timeframes, but the process has been extremely slow.
Today, traders can expect the pair to edge lower, but most likely, the price will remain in one place for most of the day. Therefore, traders shouldn't count on strong movements.
The key levels on the 5M chart are 1.0483, 1.0526, 1.0568, 1.0611, 1.0678, 1.0726-1.0733, 1.0797-1.0804, 1.0838-1.0856, 1.0888-1.0896, 1.0940, 1.0971-1.0981. For Thursday, no significant events are scheduled in either the Eurozone or the US, so we are likely in for a "boring Thursday".
1) Signal strength is determined by the time taken for its formation (either a bounce or level breach). A shorter formation time indicates a stronger signal.
2) If two or more trades around a certain level are initiated based on false signals, subsequent signals from that level should be disregarded.
3) In a flat market, any currency pair can produce multiple false signals or none at all. In any case, the flat trend is not the best condition for trading.
4) Trading activities are confined between the onset of the European session and mid-way through the U.S. session, after which all open trades should be manually closed.
5) On the 30-minute timeframe, trades based on MACD signals are only advisable amidst substantial volatility and an established trend, confirmed either by a trendline or trend channel.
6) If two levels lie closely together (ranging from 5 to 15 pips apart), they should be considered as a support or resistance zone.
Support and Resistance price levels can serve as targets when buying or selling. You can place Take Profit levels near them.
Red lines represent channels or trend lines, depicting the current market trend and indicating the preferable trading direction.
The MACD(14,22,3) indicator, encompassing both the histogram and signal line, acts as an auxiliary tool and can also be used as a signal source.
Significant speeches and reports (always noted in the news calendar) can profoundly influence the price dynamics. Hence, trading during their release calls for heightened caution. It may be reasonable to exit the market to prevent abrupt price reversals against the prevailing trend.
Beginners should always remember that not every trade will yield profit. Establishing a clear strategy coupled with sound money management is the cornerstone of sustained trading success.
InstaForex analytical reviews will make you fully aware of market trends! Being an InstaForex client, you are provided with a large number of free services for efficient trading.

