 Stay
Stay 
Trading Conditions
Products
Tools


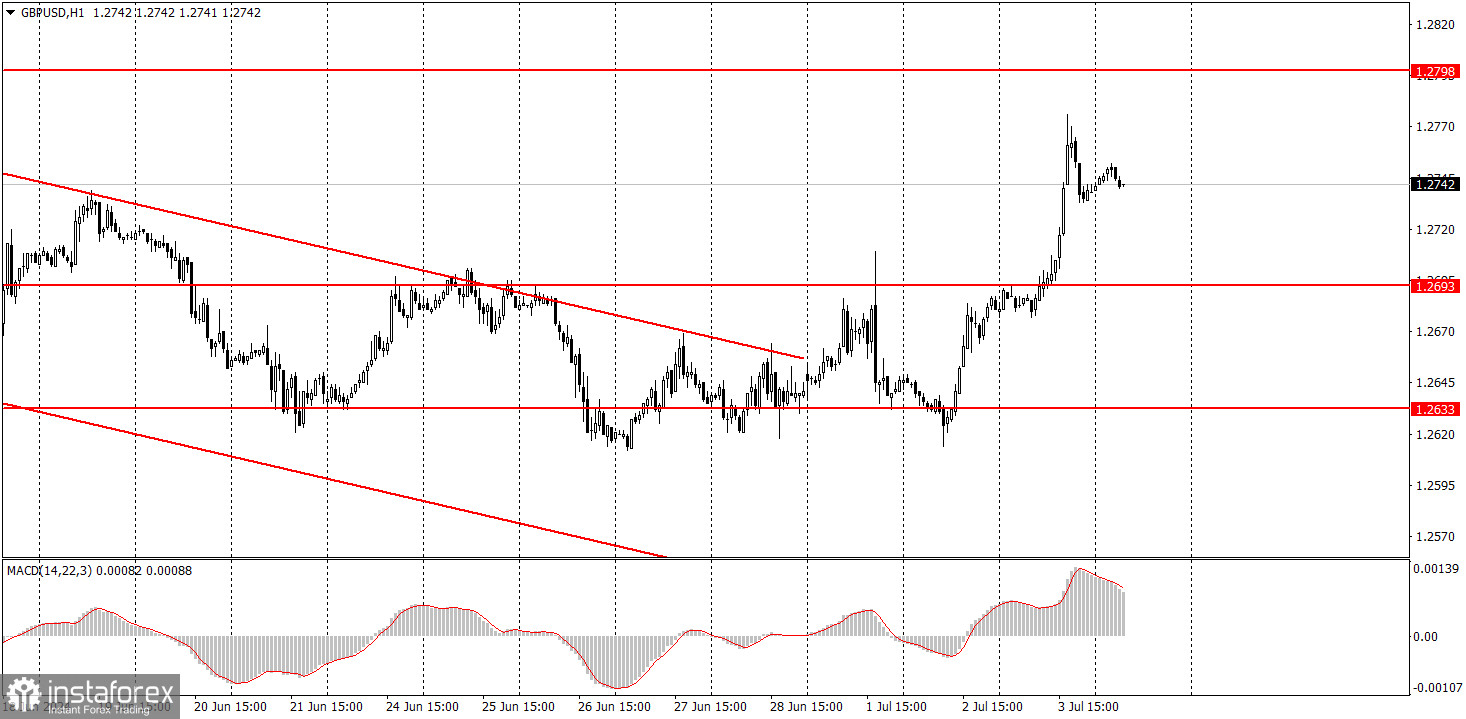
Yesterday, GBP/USD also showed a strong upward movement, which was triggered by weak US macro data. We had warned you that it was worth paying attention to the ISM and ADP reports. Both, if not a complete disappointment, turned out weaker than expected. Therefore, the dollar's decline in the second half of the day was entirely predictable. Unfortunately, the market continues to eagerly respond to any news of weakness in the US economy, even though it is much stronger than the UK's. The market no longer cares if the Federal Reserve doesn't plan to lower its rate anytime soon. The pound sterling should have fallen below the 1.23 level, at least, but instead, it has been stuck in a flat range for more than six months, as clearly seen on the daily timeframe. The sideways nature of the pair's movement is clearly visible on the hourly chart. Today, we can only expect a correction after yesterday's growth, and the pair may show weak volatility.
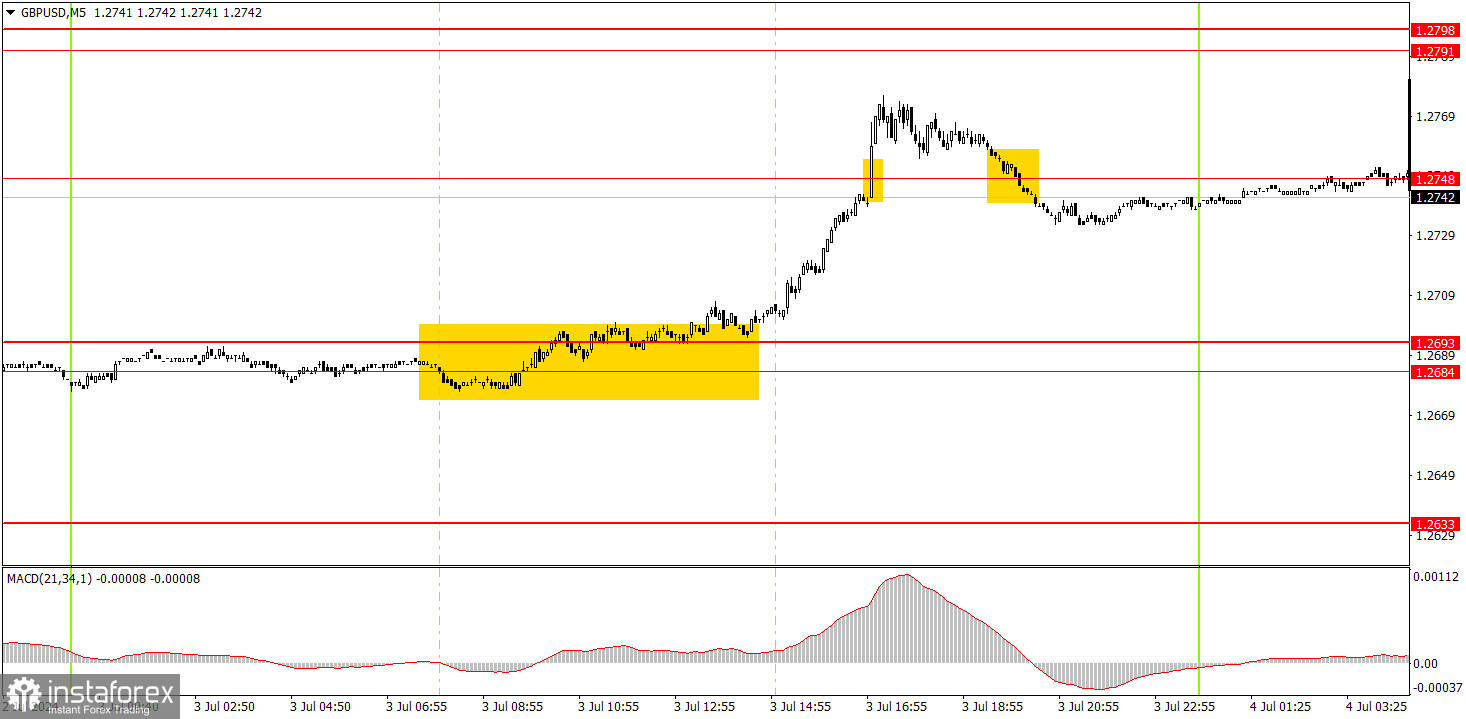
A very good buy signal was formed on the 5-minute timeframe when the price broke through the 1.2684-1.2693 area. After that, the price rose to the 1.2748 level, broke through it, and then it edged lower. Therefore, novice traders could close their long positions either above the 1.2748 level or when the price settled below it and formed a sell signal. In any case, the profit amounted to at least 40 pips. As a reminder, it is possible to execute trading signals and gain good profits with a good trend. If the market is flat, then any kind of signal will not bring profit.
On the hourly chart, GBP/USD continues to show promising signs of forming a downtrend, but this doesn't mean that the pair can't form an upward trend. The pair has been seeing a lot of sideways actions in recent weeks, and has not been able to overcome the first significant support area on its way down – 1.2605-1.2633. So the British currency is rising again, and overall, it continues to show erratic movements.
On Thursday, the pound sterling may retreat after yesterday's growth. However, US markets are closed in observance of the Independence Day holiday, so we don't expect strong movements from the pair.
The key levels on the 5M chart are 1.2457, 1.2502, 1.2541-1.2547, 1.2605-1.2633, 1.2684-1.2693, 1.2748, 1.2791-1.2798, 1.2848-1.2860, 1.2913, and 1.2980. Today, the UK will publish the second estimate of the Construction PMI data. This is a completely secondary indicator that may only provoke a minor market reaction.
1) Signal strength is determined by the time taken for its formation (either a bounce or level breach). A shorter formation time indicates a stronger signal.
2) If two or more trades around a certain level are initiated based on false signals, subsequent signals from that level should be disregarded.
3) In a flat market, any currency pair can produce multiple false signals or none at all. In any case, the flat trend is not the best condition for trading.
4) Trading activities are confined between the onset of the European session and mid-way through the U.S. session, after which all open trades should be manually closed.
5) On the 30-minute timeframe, trades based on MACD signals are only advisable amidst substantial volatility and an established trend, confirmed either by a trendline or trend channel.
6) If two levels lie closely together (ranging from 5 to 15 pips apart), they should be considered as a support or resistance zone.
Support and Resistance price levels can serve as targets when buying or selling. You can place Take Profit levels near them.
Red lines represent channels or trend lines, depicting the current market trend and indicating the preferable trading direction.
The MACD(14,22,3) indicator, encompassing both the histogram and signal line, acts as an auxiliary tool and can also be used as a signal source.
Significant speeches and reports (always noted in the news calendar) can profoundly influence the price dynamics. Hence, trading during their release calls for heightened caution. It may be reasonable to exit the market to prevent abrupt price reversals against the prevailing trend.
Beginners should always remember that not every trade will yield profit. Establishing a clear strategy coupled with sound money management is the cornerstone of sustained trading success.
InstaForex analytical reviews will make you fully aware of market trends! Being an InstaForex client, you are provided with a large number of free services for efficient trading.


