 Stay
Stay 
Trading Conditions
Products
Tools


Looking at the economic reports, it seems strange for the dollar to weaken. The final data on business activity indices in the Eurozone turned out to be better than the preliminary estimates, but the same thing happened in the United States. However, we're talking about a decline in the Eurozone, while US indicators showed growth. Moreover, employment growth in the United States was much higher than expected. So it should have been logical for the dollar to rise.
The issue lies in the growing influence of political factors. The debates between Biden and Trump threw the Democratic Party and its supporters into a state of panic. Just yesterday, media outlets began publishing articles suggesting that Biden might withdraw his candidacy from the upcoming presidential election. This introduces a significant factor of uncertainty, which contributed to the dollar's weakness.
Today, the market will likely remain stagnant in observance of the Independence Day holiday in the US.
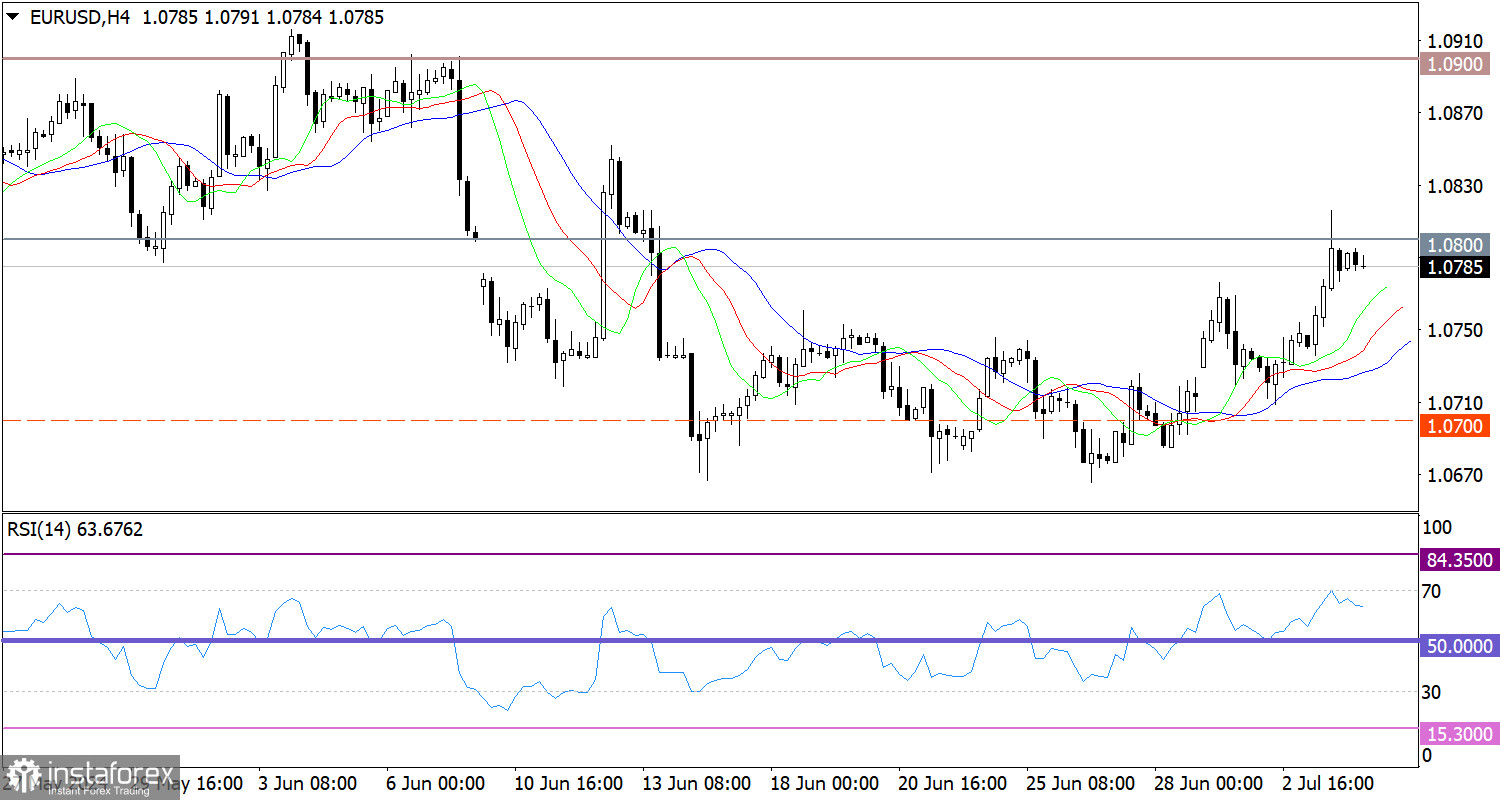
EUR/USD is showing a surge in the volume of long positions, so the pair has left the range of 1.0670/1.0750. As a result, the quote has locally risen above the 1.0800 level.
On the 4-hour chart, the RSI technical indicator is hovering in the upper area of 50/70, which indicates a bullish bias. It's important to highlight that hitting the 1.0800 level means reaching the overbought zone.
The Alligator moving averages are headed upwards on the same chart.
In order to enter the next stage of growth, the price must settle above 1.0800, which theoretically could indicate a recovery process relative to the recent corrective cycle. Otherwise, the price could turn the other way and move towards the upper boundary of the previous range.
In terms of complex indicator analysis, the short term and intraday periods point to a bullish bias.
InstaForex analytical reviews will make you fully aware of market trends! Being an InstaForex client, you are provided with a large number of free services for efficient trading.

