 Stay
Stay 
Trading Conditions
Products
Tools


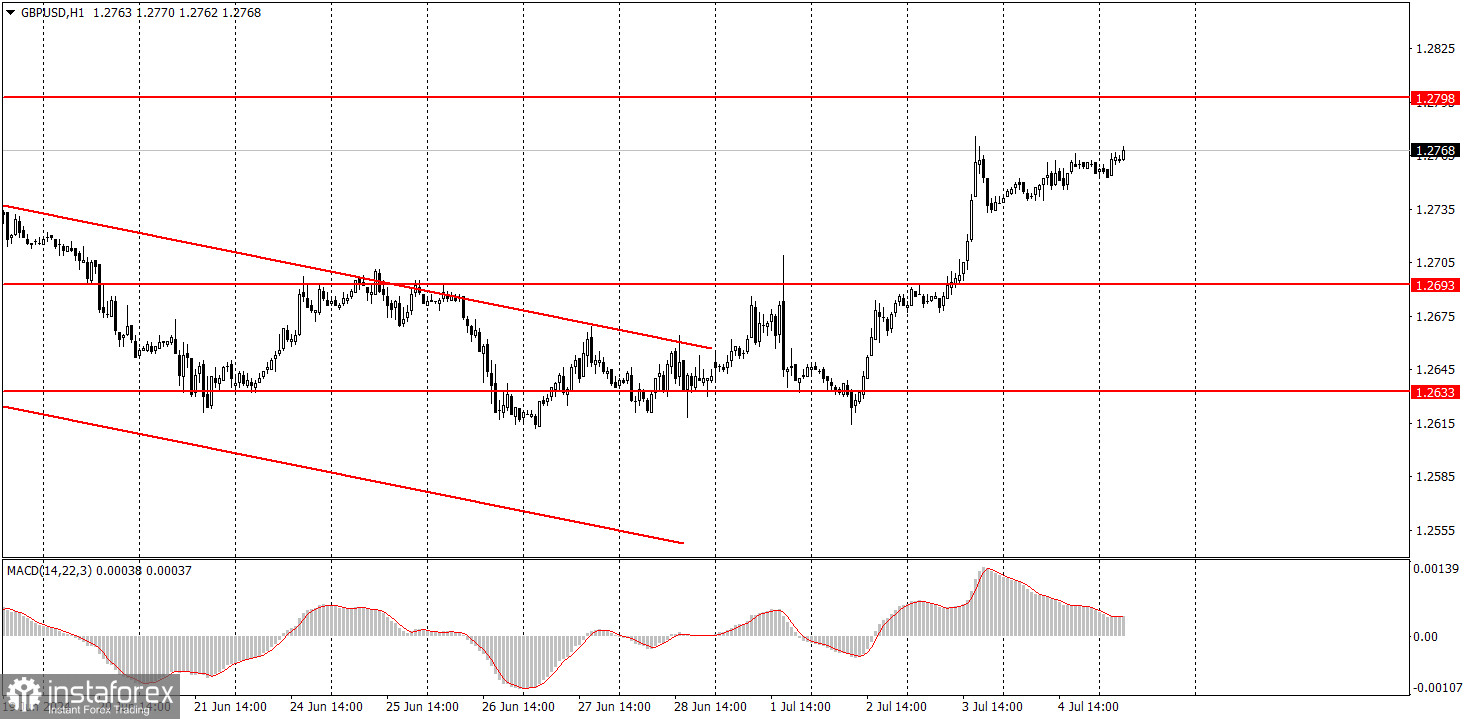
Yesterday, GBP/USD calmly continued its upward movement. Volatility was low since it was an official holiday in the United States. The UK published the second estimate of its Construction PMI data for June, which is of secondary importance. Nevertheless, the market found reasons to buy the pound. Just a head's up, the latest rise started after three bounces from the support area of 1.2605-1.2633. The bears could not counter the bulls at this significant area.
On Tuesday, there were no fundamental or macroeconomic reasons for the rise. On the contrary, Federal Reserve Chair Jerome Powell maintained a hawkish tone in his speech, which could have supported the dollar. The JOLTs report also exceeded expectations, which should have supported the U.S. currency. But the dollar doesn't rise even when factors are present. In fact, it falls when there are no factors. We have observed the same pattern in the forex market for 9 months now.
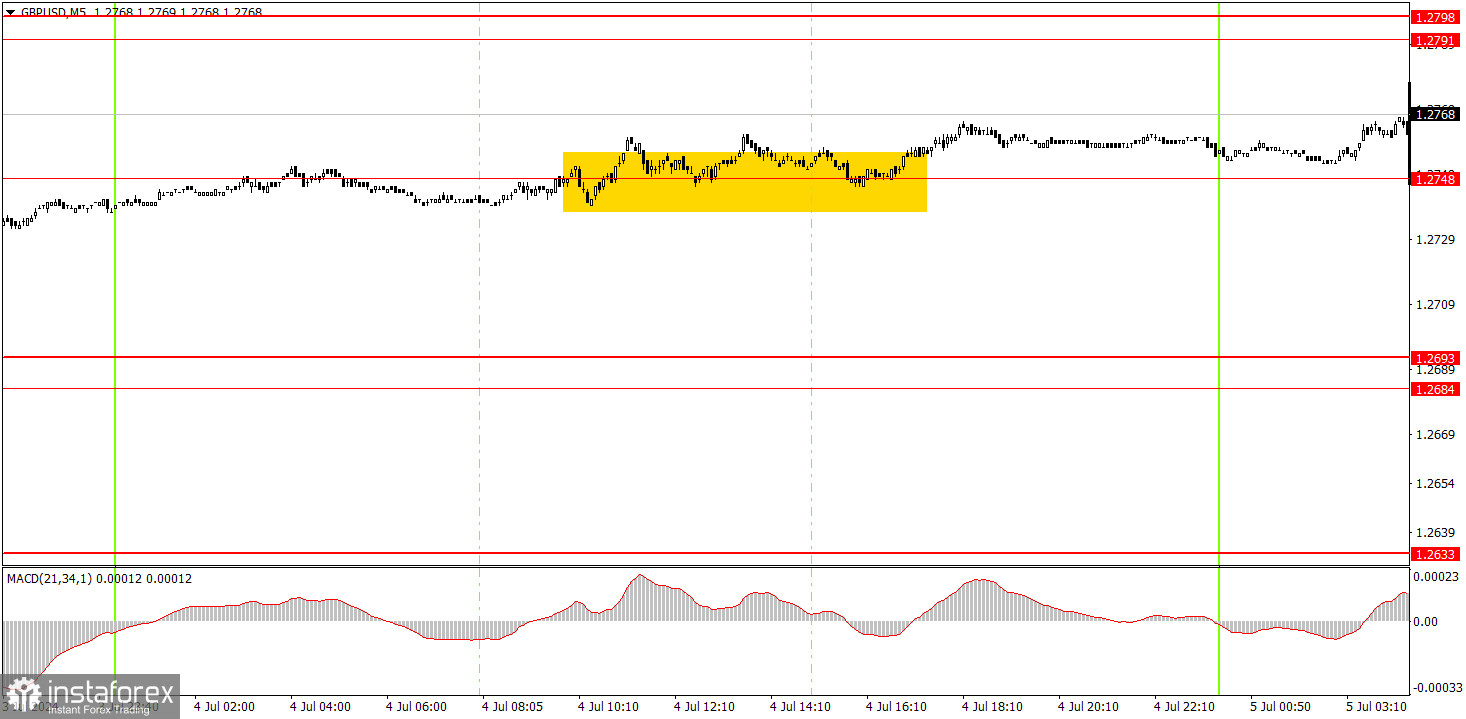
The pair formed one buy signal on the 5-minute timeframe. Similar to the euro, the price tried to overcome the 1.2748 level for 5-6 hours. When it succeeded, the pair did not actively rise as volatility was only 30 pips. However, you could have stayed in the long position overnight since the pair continues to show weak movements, making it unrealistic to expect a signal to play out within a single day.
On the hourly chart, GBP/USD continues to show promising signs of forming a downtrend, but this doesn't mean that the pair can't form an upward trend. The pair has been seeing a lot of sideways actions in recent weeks, and has not been able to overcome the first significant support area on its way down – 1.2605-1.2633. So the British currency is rising again, and overall, it continues to show erratic and often illogical movements.
On Friday, the pound sterling can gradually rise with low volatility, at least until the U.S. session. Further, everything will depend on the values of the U.S. economic reports.
The key levels on the 5M chart are 1.2457, 1.2502, 1.2541-1.2547, 1.2605-1.2633, 1.2684-1.2693, 1.2748, 1.2791-1.2798, 1.2848-1.2860, 1.2913, and 1.2980. Today, the U.S. will publish crucial reports on the labor market and unemployment, while the UK economic calendar is light. Therefore, you can expect movements in the afternoon.
1) Signal strength is determined by the time taken for its formation (either a bounce or level breach). A shorter formation time indicates a stronger signal.
2) If two or more trades around a certain level are initiated based on false signals, subsequent signals from that level should be disregarded.
3) In a flat market, any currency pair can produce multiple false signals or none at all. In any case, the flat trend is not the best condition for trading.
4) Trading activities are confined between the onset of the European session and mid-way through the U.S. session, after which all open trades should be manually closed.
5) On the 30-minute timeframe, trades based on MACD signals are only advisable amidst substantial volatility and an established trend, confirmed either by a trendline or trend channel.
6) If two levels lie closely together (ranging from 5 to 15 pips apart), they should be considered as a support or resistance zone.
Support and Resistance price levels can serve as targets when buying or selling. You can place Take Profit levels near them.
Red lines represent channels or trend lines, depicting the current market trend and indicating the preferable trading direction.
The MACD(14,22,3) indicator, encompassing both the histogram and signal line, acts as an auxiliary tool and can also be used as a signal source.
Significant speeches and reports (always noted in the news calendar) can profoundly influence the price dynamics. Hence, trading during their release calls for heightened caution. It may be reasonable to exit the market to prevent abrupt price reversals against the prevailing trend.
Beginners should always remember that not every trade will yield profit. Establishing a clear strategy coupled with sound money management is the cornerstone of sustained trading success.
InstaForex analytical reviews will make you fully aware of market trends! Being an InstaForex client, you are provided with a large number of free services for efficient trading.


