 Stay
Stay 
Trading Conditions
Products
Tools


EUR/USD continued to trade in a narrow range on Thursday. Despite the release of at least two reasonably significant reports yesterday, volatility did not increase, and market participants showed little interest in trading. Another important point is that U.S. GDP grew by 2.8%, surpassing forecasts of 2.0-2.5% and the first quarter's figure of 1.4%. This suggests that the U.S. economy remains robust. Secondly, the Federal Reserve may keep rates at their peak without fearing a recession. However, the U.S. dollar failed to appreciate despite favorable conditions. Yes, the durable goods orders report in June disappointed the market, showing a value of -6.6%, significantly worse than forecasts. But which indicator is more important? The state of the entire economy or just the sales of durable goods?
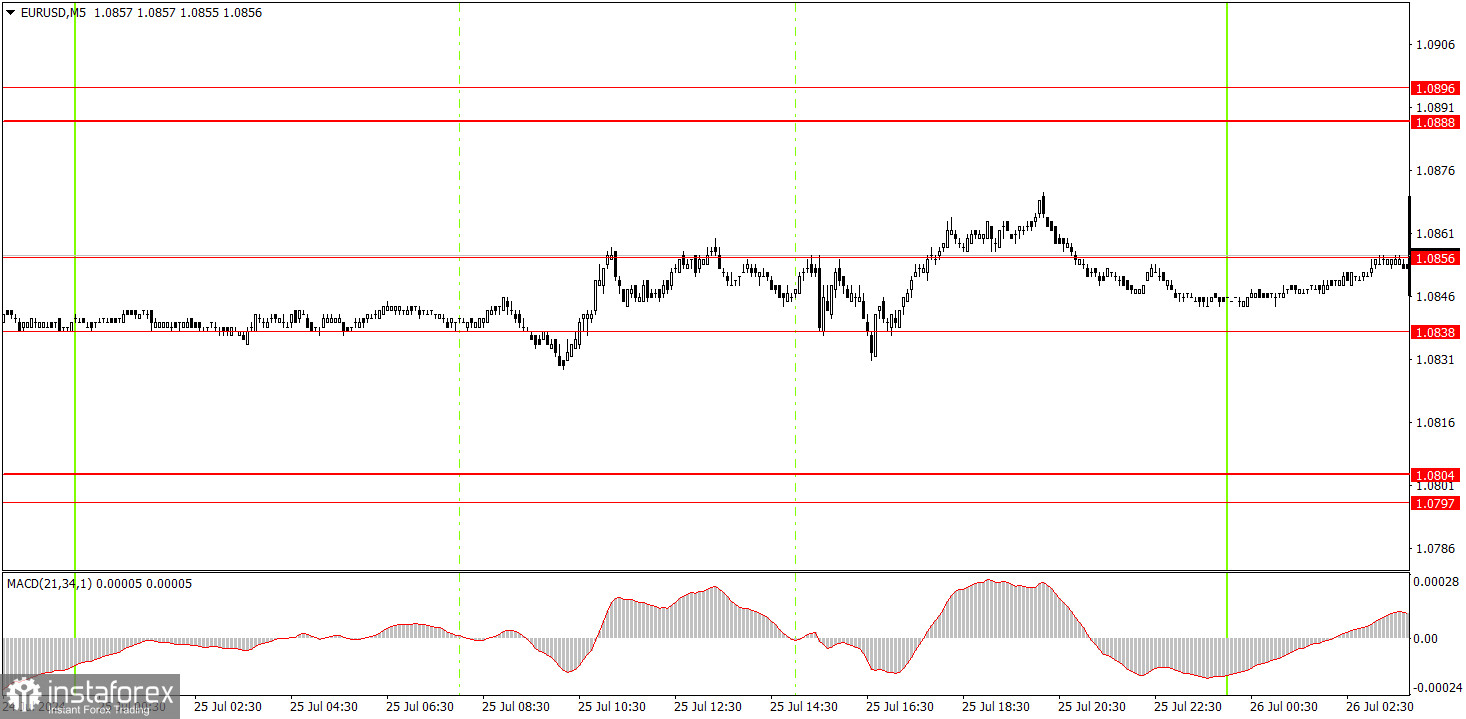
We didn't even mark any trading signals in the 5-minute timeframe. The chart above clearly shows that the price spent most of the day between the levels of 1.0838 and 1.0856. Trading between these levels was meaningless. It also made no sense to open trades after the price settled below or above this range, as the current volatility did not allow for expecting a solid movement in the intended direction, and Stop Losses would have to be set beyond the opposite level. The risk/reward ratio was initially abysmal.
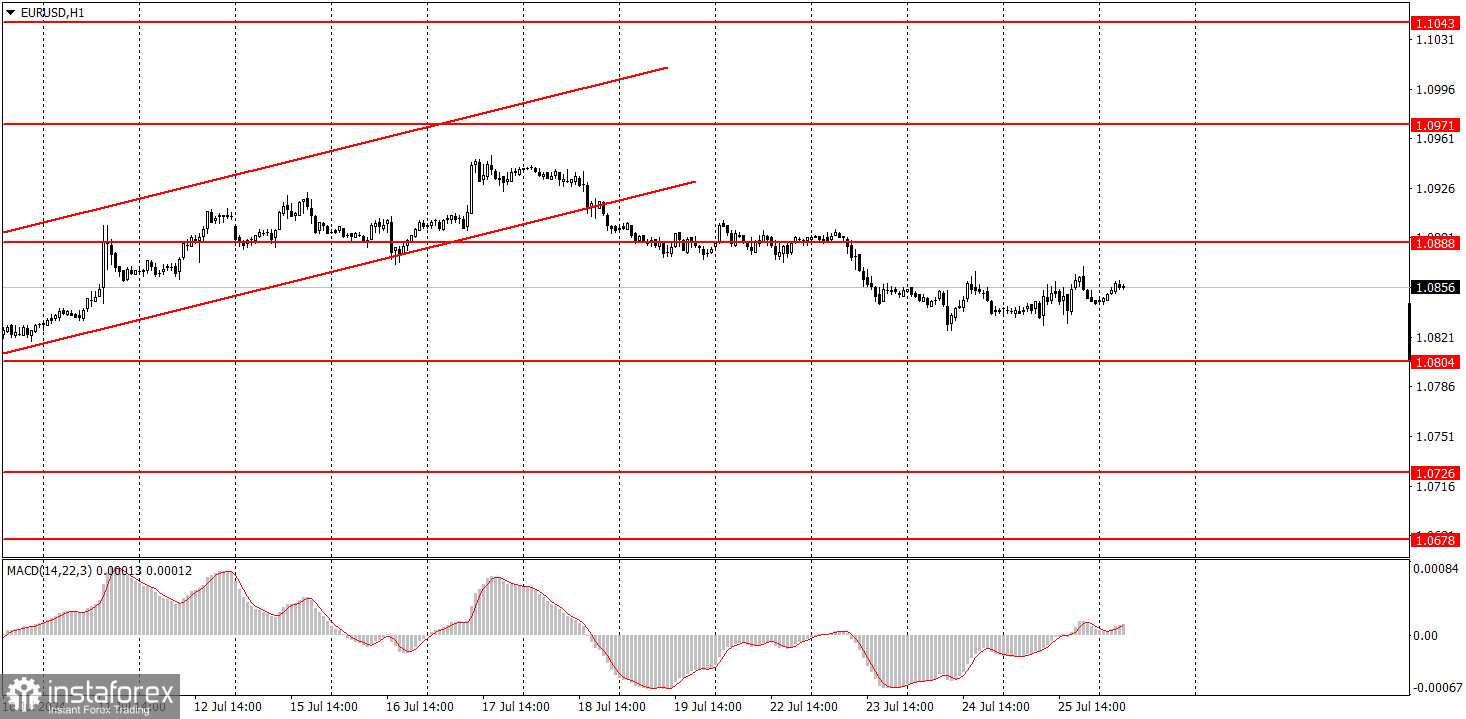
In the hourly timeframe, EUR/USD settled below the ascending channel, allowing it to start a new local downward trend. We believe the euro has fully factored in all the bullish factors, so a significant correction is needed. However, the nature of the movements is best seen in the 24-hour timeframe. It is the same flat range between 1.0650 and 1.1000. Yesterday, the dollar missed a great opportunity to continue its upward movement. Volatility remains low.
On Friday, novice traders may try trading again from the 1.0838-1.0856 area. There will be a few important events today, but yesterday, we saw how important events do not necessarily lead to strong movements. We expect the quotes to move upwards at some point, after which a decline could resume.
The key levels to consider on the 5M timeframe are 1.0526, 1.0568, 1.0611, 1.0678, 1.0726-1.0733, 1.0797-1.0804, 1.0838-1.0856, 1.0888-1.0896, 1.0940, 1.0971-1.0981. No significant events are planned in the Eurozone on Friday, while the U.S. will release less critical reports on personal income and expenditure, the personal consumption expenditures price index, and the Michigan consumer sentiment index.
1) The strength of a signal is determined by the time it took for the signal to form (bounce or level breakthrough). The shorter the time required, the stronger the signal.
2) If two or more trades around a certain level are initiated based on false signals, subsequent signals from that level should be ignored.
3) In a flat market, any currency pair can produce multiple false signals or none at all. In any case, it's better to stop trading at the first signs of a flat market.
4) Trades should be opened between the start of the European session and mid-way through the U.S. session. All trades must be closed manually after this period.
5) In the hourly time frame, trades based on MACD signals are only advisable amidst substantial volatility and an established trend, confirmed either by a trendline or trend channel.
6) If two levels are too close to each other (from 5 to 20 pips), they should be considered as a support or resistance zone.
7) After moving 15 pips in the intended direction, the Stop Loss should be set to break-even.
Support and Resistance price levels can serve as targets when buying or selling. You can place Take Profit levels near them.
Red lines represent channels or trend lines that depict the current trend and indicate the preferred trading direction.
The MACD (14,22,3) indicator, encompassing both the histogram and signal line, acts as an auxiliary tool and can also be used as a source of signals.
Important speeches and reports (always noted in the news calendar) can profoundly influence the price dynamics. Hence, trading during their release calls for heightened caution. It may be reasonable to exit the market to prevent abrupt price reversals against the prevailing trend.
Beginners should always remember that not every trade will yield profit. Establishing a clear strategy, coupled with effective money management, is key to long-term success in trading.
InstaForex analytical reviews will make you fully aware of market trends! Being an InstaForex client, you are provided with a large number of free services for efficient trading.


