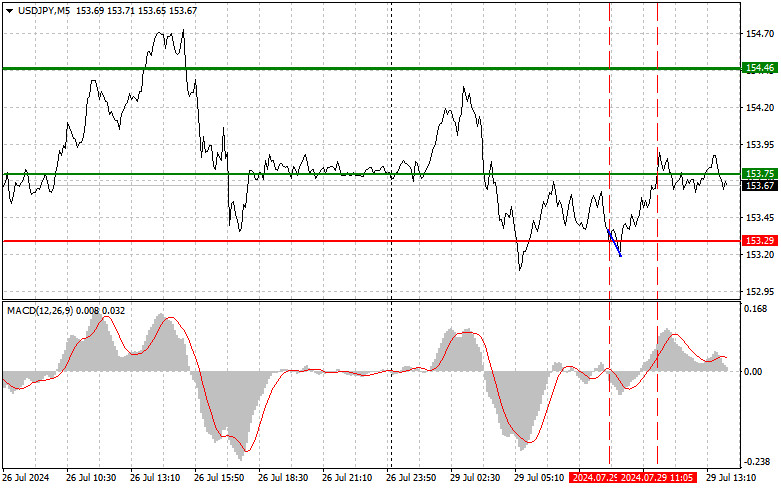
This information is provided to retail and professional clients as part of marketing communication. It does not contain and should not be construed as containing investment advice or investment recommendation or an offer or solicitation to engage in any transaction or strategy in financial instruments. Past performance is not a guarantee or prediction of future performance. Instant Trading EU Ltd. makes no representation and assumes no liability as to the accuracy or completeness of the information provided, or any loss arising from any investment based on analysis, forecast or other information provided by an employee of the Company or otherwise. Full disclaimer is available here.
Popular analytics
Analysis of Trades and Tips for Trading the Japanese Yen The test of the price at 153.29 coincided with the beginning of the MACD indicator's downward movement from the zero.
GBP/USD: Trading Plan for the U.S. Session on July 29 (Review of Morning Trades). The Pound Fell
In my morning forecast, I focused on the level of 1.2806 and planned to make market entry decisions from there. Let's look at the 5-minute chart and see what happened.
GBP/USD. July 29. Bearish Sentiment Prevails Ahead of Key Bank of England Decision
On the hourly chart, the GBP/USD pair remained below the zone of 1.2892–1.2931 on Friday, allowing for the expectation of a continued decline towards the next support zone of 1.2788–1.2801.
Bank of England to lower rates?
The British pound is in a difficult position as many traders anticipate decisive action from the Bank of England this week. Most economists predict that the UK's central bank will.
Trading Signals for GBP/USD for July 29-31, 2024: buy above 1.2806 (200 EMA - 5/8 Murray)
The eagle indicator is in the oversold zone. Therefore, we believe a technical rebound could occur in the next few hours and we will look for opportunities to buy above.
Weekly Forecast Based on Simplified Wave Analysis for EUR/USD, USD/JPY, GBP/JPY, USD/CAD, NZD/USD, and GOLD on July 29
Analysis: The EUR/USD pair continues a sideways flat movement. The unfinished section of this trend is upward, starting from mid-April. The price is between clusters of potential reversal levels.
Trading Signals for GOLD (XAU/USD) for July 29-31, 2024: sell below 2,402 (200 EMA - 6/8 Murray)
Early in the American session, gold is trading around 2,392, showing signs of exhaustion and retreating after having reached the psychological level of 2,400. According to the H4 chart, gold.
USD/JPY: trading tips for beginners for the European session on July 29
Overview of trading and tips on USD/JPY The price test of 153.44 occurred when the MACD indicator had already moved significantly below the zero mark, which limited the pair's downward.
Inflation data, tech gains lift Wall Street
PCE inflation rises modestly in June Russell 2000, S&P Small Cap 600 gain for fourth day in five Deckers, Baker Hughes, Norfolk Southern rally after results Indices rise Friday.
Show more
This section is updated daily and contains market analysis prepared by professional analysts on behalf of InstaForex. Each of the specialists presents analytical reviews in accordance with his/her vision of the current situation on the foreign exchange and other markets. However, the outlooks below are neither recommendations nor instructions to any actions. They contain analysis of the current situation on financial markets. In some cases, analysts' opinions about current market conditions may differ.