 Stay
Stay 
Trading Conditions
Products
Tools


On Wednesday, the GBP/USD pair also continued to trade sideways with low volatility. The range from the day's low to high was only 43 pips. And this was on the day of the FOMC meeting... What can be said about other events like the ADP report? The market had been consistently selling the British pound for several weeks, but the pair has just been standing still this week. Today, the Bank of England meeting will take place, where a decision to begin a cycle of monetary policy easing might be made. In theory, such news should provoke a strong market reaction. However, in practice, we doubt we will see a promising trend today. If the market does not want to trade, no news will make it do so.
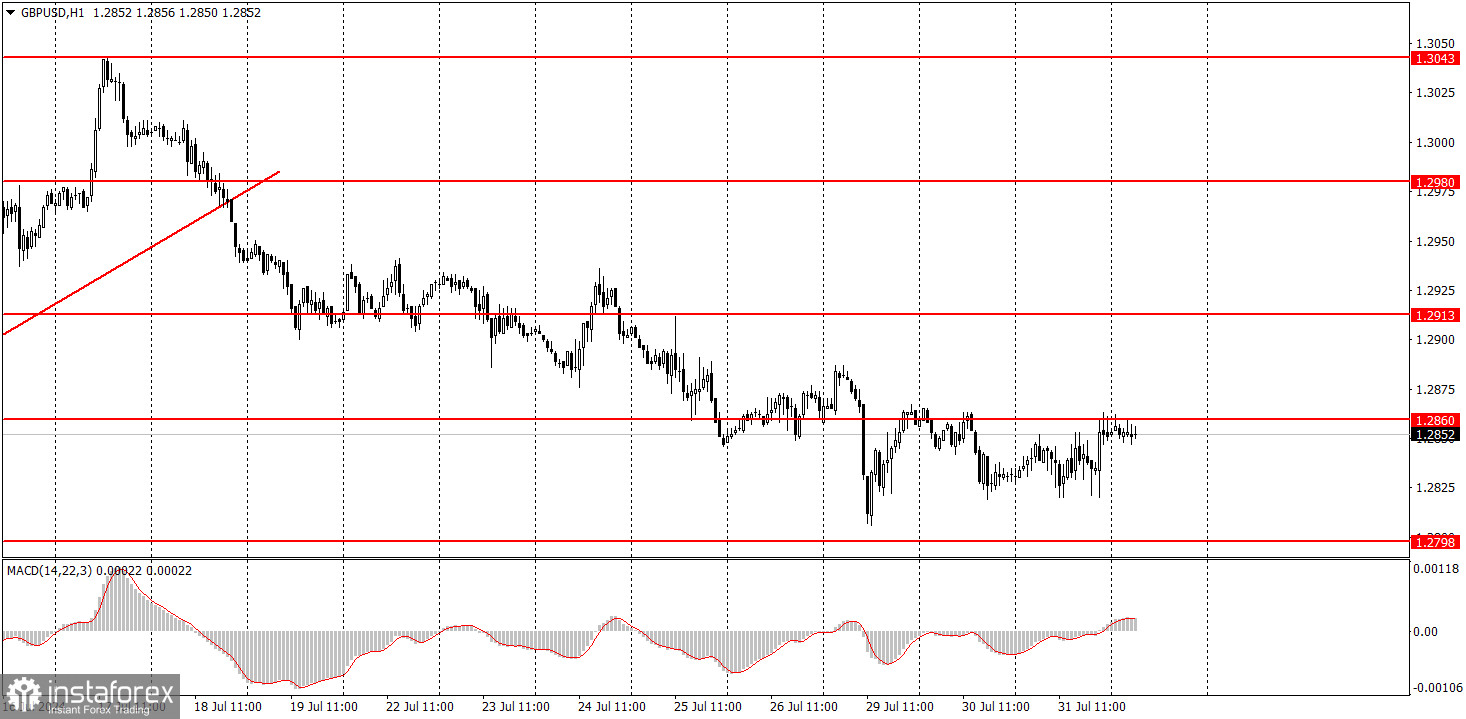
In addition to low volatility this week, traders have faced a flat market, which is visible on the hourly time frame. The macroeconomic background has no impact on the pair's movement. A market reaction to an event amounting to 20 pips is unlikely to interest anyone.
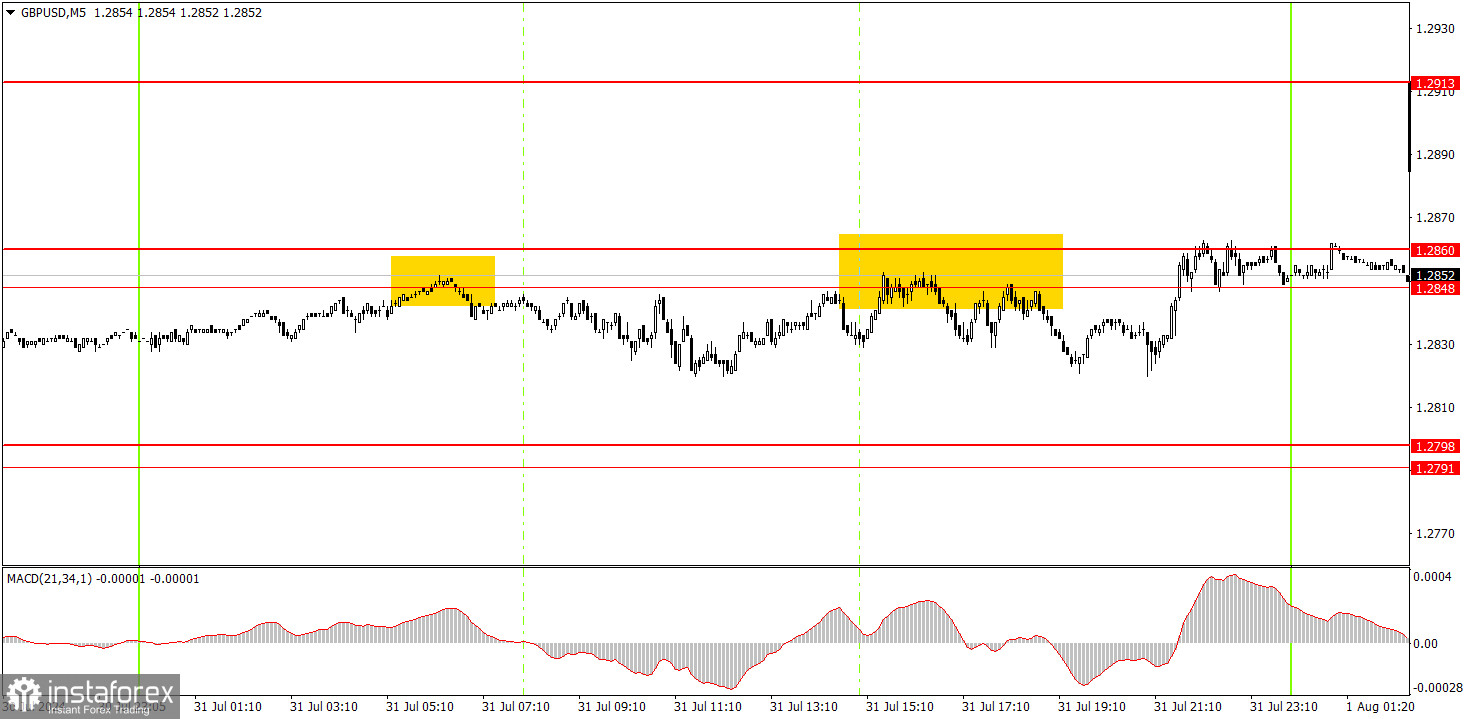
Two trading signals were formed in the 5-minute time frame on Wednesday. The price twice rebounded from the 1.2848-1.2860 area. In the first case, it moved 15 pips in the intended direction, and in the second case, 20 pips. We remind novice traders that if there are no market movements, it is impossible to make a profit from any trading signals. The problem is not with the levels but the market's unwillingness to trade.
GBP/USD can continue the new downtrend in the hourly time frame. The pair has breached the ascending trendline, so we might observe a decline for at least a couple of weeks rather than growth. Ideally, the pound should drop by at least 400-500 pips. The market has already processed all the bullish factors about three times, the dollar is undervalued, and the BoE may start lowering its rates as early as this week. The British currency has more reasons to fall than to start a new rise.
On Thursday, novice traders may trade within the range of 1.2848-1.2860. If the price bounces from this range, traders may open new short positions, while a consolidation above this mark will enable long positions.
The key levels to consider on the 5M timeframe are 1.2605-1.2633, 1.2684-1.2693, 1.2748, 1.2791-1.2798, 1.2848-1.2860, 1.2913, 1.2980-1.2993, 1.3043, 1.3102-1.3107, 1.3145. Today, the results of the BoE meeting will be announced, and there will also be a speech by BoE Governor Andrew Bailey. In the U.S., the important ISM Manufacturing PMI will be released. However, even with this set of events, we have low expectations for a strong movement during the day.
1) The strength of a signal is determined by the time it took for the signal to form (bounce or level breakthrough). The shorter the time required, the stronger the signal.
2) If two or more trades around a certain level are initiated based on false signals, subsequent signals from that level should be ignored.
3) In a flat market, any currency pair can produce multiple false signals or none at all. In any case, it's better to stop trading at the first signs of a flat market.
4) Trades should be opened between the start of the European session and mid-way through the U.S. session. All trades must be closed manually after this period.
5) In the hourly time frame, trades based on MACD signals are only advisable amidst substantial volatility and an established trend, confirmed either by a trendline or trend channel.
6) If two levels are too close to each other (from 5 to 20 pips), they should be considered as a support or resistance zone.
7) After moving 15 pips in the intended direction, the Stop Loss should be set to break-even.
Support and Resistance price levels can serve as targets when buying or selling. You can place Take Profit levels near them.
Red lines represent channels or trend lines that depict the current trend and indicate the preferred trading direction.
The MACD (14,22,3) indicator, encompassing both the histogram and signal line, acts as an auxiliary tool and can also be used as a source of signals.
Important speeches and reports (always noted in the news calendar) can profoundly influence the price dynamics. Hence, trading during their release calls for heightened caution. It may be reasonable to exit the market to prevent abrupt price reversals against the prevailing trend.
Beginners should always remember that not every trade will yield profit. Establishing a clear strategy, coupled with effective money management, is key to long-term success in trading.
InstaForex analytical reviews will make you fully aware of market trends! Being an InstaForex client, you are provided with a large number of free services for efficient trading.


