 Stay
Stay 
Trading Conditions
Products
Tools


The EUR/USD pair sustained upward movement on Tuesday without apparent reasons. We have repeatedly mentioned that the market has not needed substantial reasons to sell the U.S. dollar in recent weeks and months. For those who doubted this, believing that all market movements are always justified, the current situation offers a clear example. The euro continues to rise rapidly without any correction despite no significant events or reports in the U.S. or the EU on Monday and Tuesday.
Yesterday, the Eurozone released the second estimate of inflation for July, which was identical in significance to the first one. Therefore, this report could not have triggered the euro's rise. Moreover, this week Olli Rehn stated that the European Central Bank might lower rates a second time in September, but the market did not react to this information. As we can see, the currency pair is not influenced by the fact that the ECB has already cut rates once and may do so again in September.
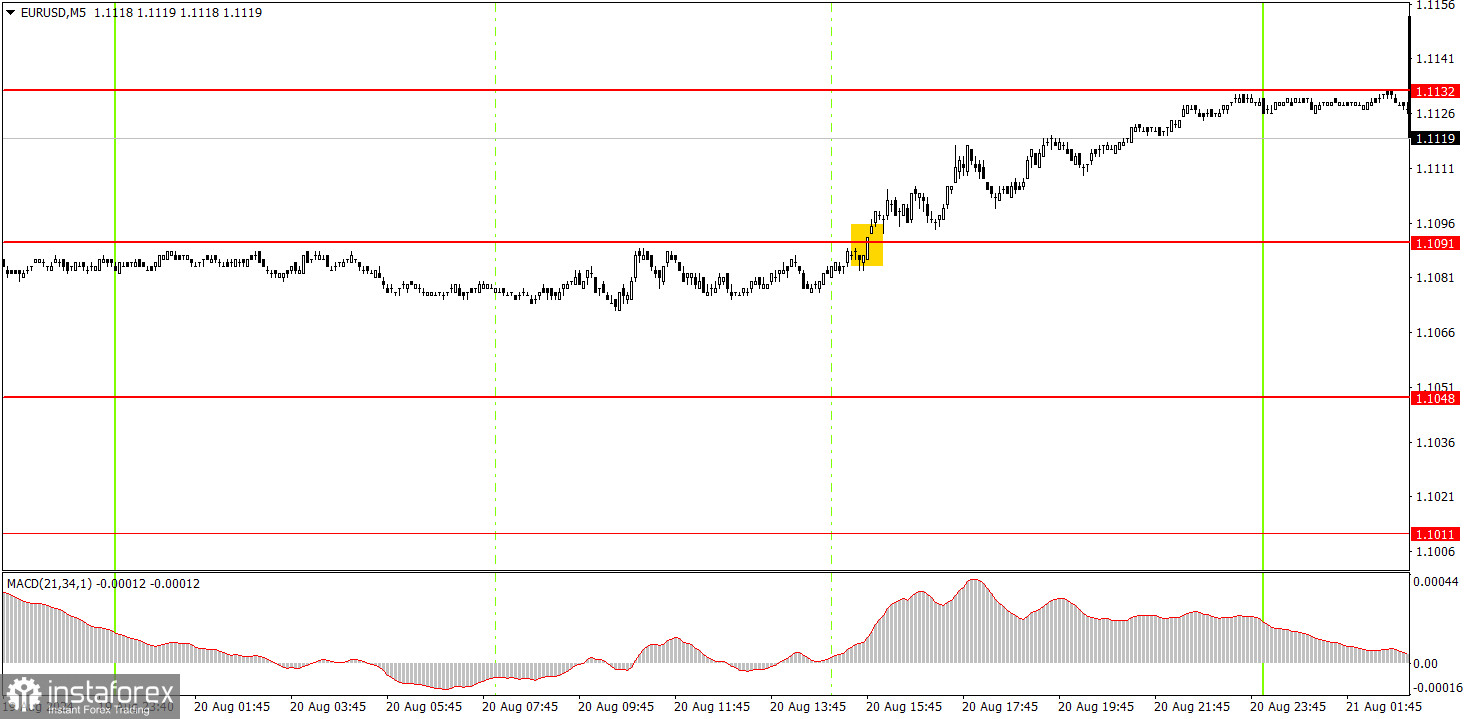
Only one buy signal was formed in the 5-minute timeframe on Tuesday. At the start of the American trading session, the price breached the level of 1.1091, leading to a movement towards 1.1132, which it reached after about 10 hours. This trade could have earned around 20-25 pips. It is also worth noting that volatility has once again decreased and remains low.
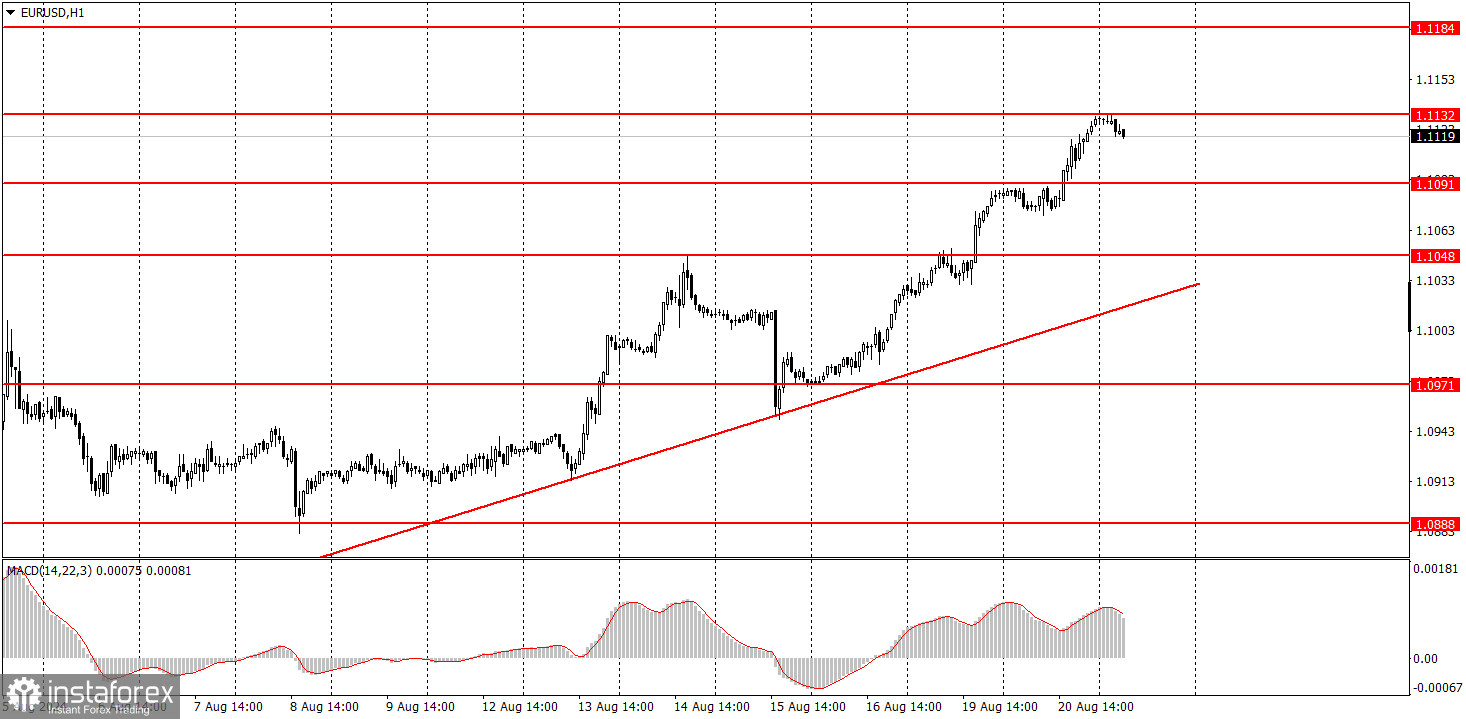
EUR/USD has established a new upward trend supported by a trend line in the hourly time frame. We believe the euro has fully factored in all the bullish factors, so we do not expect further upward movement. However, the market again shows it is ready to react to almost any event by panic selling the dollar. And if there are no events, it is prepared to sell the dollar for no reason. Therefore, expectations aside, the current technical picture should not be ignored. A decline in the pair can be expected after the price consolidates below the trendline.
On Wednesday, novice traders might expect a drop, as the price has bounced off the 1.1132 level. However, any decline could be very weak, much like the intraday volatility.
The key levels to consider on the 5M time frame are 1.0611, 1.0678, 1.0726-1.0733, 1.0797-1.0804, 1.0838-1.0856, 1.0888-1.0896, 1.0940, 1.0971, 1.1011, 1.1048, 1.1091, 1.1132, and 1.1184. On Wednesday, no significant events are scheduled in the Eurozone, while the Federal Reserve's minutes will be published late in the evening in the U.S. We do not expect it to contain any crucial information, but the market is currently selling the dollar under any circumstances.
1) The strength of a signal is determined by the time it takes for the signal to form (bounce or level breakthrough). The less time it took, the stronger the signal.
2) If two or more trades around a certain level are initiated based on false signals, subsequent signals from that level should be ignored.
3) In a flat market, any currency pair can form multiple false signals or none at all. In any case, it's better to stop trading at the first signs of a flat market.
4) Trades should be opened between the start of the European session and midway through the U.S. session. After this period, all trades must be closed manually.
5) In the hourly time frame, trades based on MACD signals are only advisable amidst substantial volatility and an established trend confirmed by a trendline or trend channel.
6) If two levels are too close to each other (5 to 20 pips), they should be considered support or resistance.
7) After moving 20 pips in the intended direction, the Stop Loss should be set to break even.
Support and Resistance price levels: targets for opening long or short positions. You can place Take Profit levels near them.
Red lines: channels or trend lines that depict the current trend and indicate the preferred trading direction.
The MACD (14,22,3) indicator, encompassing both the histogram and signal line, acts as an auxiliary tool and can also be used as a source of signals.
Important speeches and reports (always noted in the news calendar) can profoundly influence the movement of a currency pair. Hence, trading during their release calls for heightened caution. It may be reasonable to exit the market to prevent abrupt price reversals against the prevailing trend.
Beginners should always remember that not every trade will yield profit. Developing a clear strategy and effective money management is key to success in trading over a long period.
InstaForex analytical reviews will make you fully aware of market trends! Being an InstaForex client, you are provided with a large number of free services for efficient trading.


