 Stay
Stay 
Trading Conditions
Products
Tools


The GBP/USD pair also continued its upward movement on Tuesday. Even novice traders can now observe the pair's behavior over the past weeks—an uninterrupted, almost non-corrective rise. Previously, it could be said that macroeconomic data from the U.S. regularly pressured the dollar or that Federal Reserve representatives had finally discussed lowering the key rate. However, currently, no factors are pushing the dollar down. Yet, the market continues to panic-sell the American currency. There is no logic to such movements. The most interesting aspect is that this illogical rise will end sooner or later, and it is quite possible that an equally illogical fall will begin.
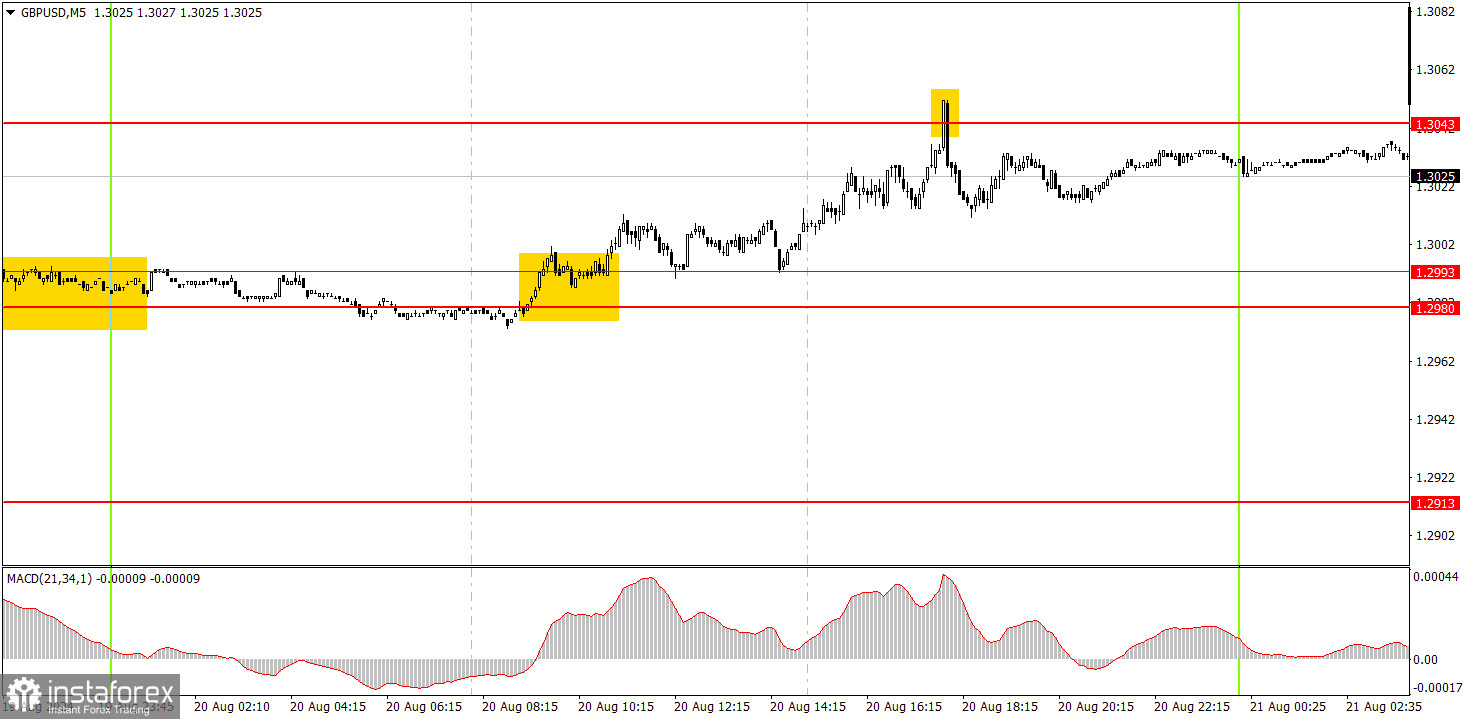
In the 5-minute time frame, two trading signals were formed on Tuesday. Initially, the price stabilized above the 1.2980-1.2993 range. At this point, novice traders could have opened long positions. During the middle of the U.S. session, the nearest target level of 1.3043 was reached, followed by a significant rebound. At this moment, long positions should have been closed, and short positions opened. By the end of the day, the pair fell by 15-20 pips, which could also have been captured by manually closing the trade. The short position could also be kept open for Wednesday, anticipating a correction to the 1.2980-1.2993 area.
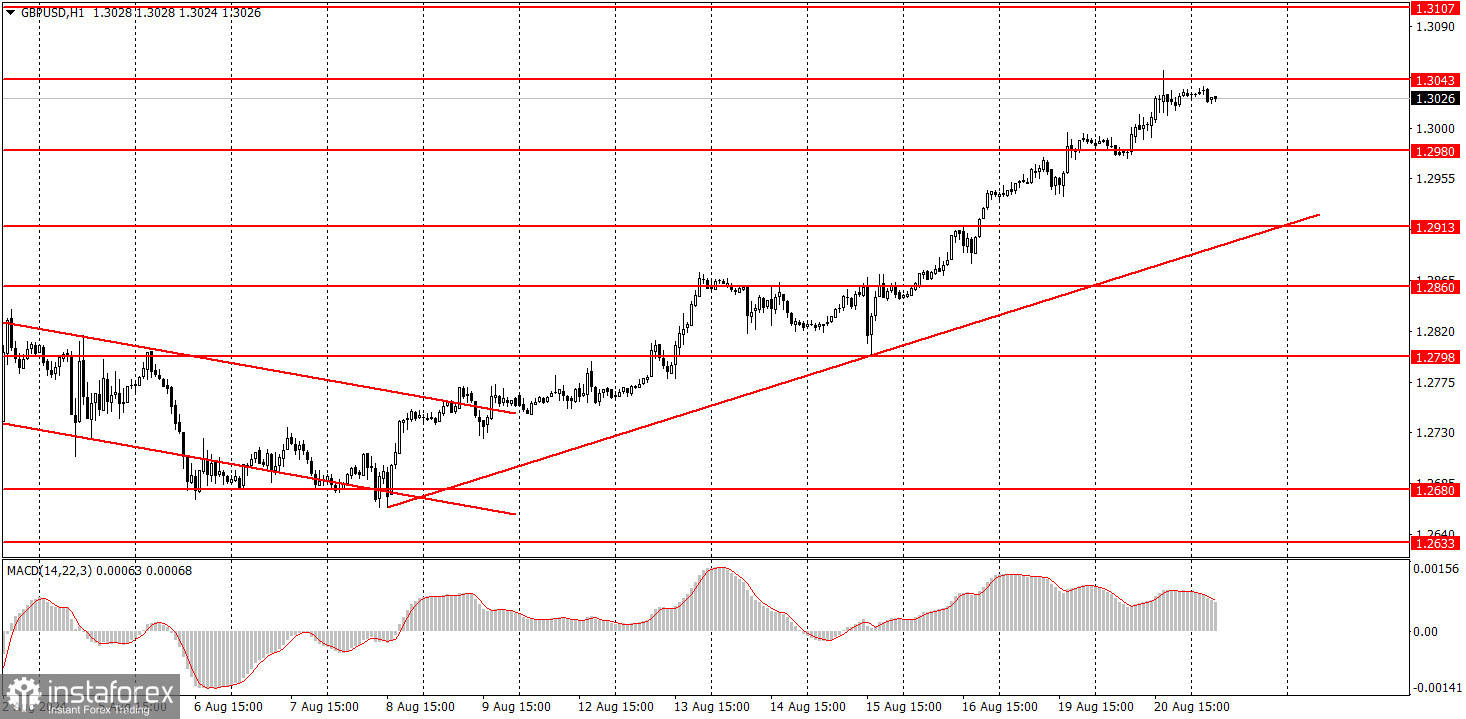
In the hourly time frame, GBP/USD has a good chance of sutaining the downtrend, but currently, a local uptrend persists. The British pound is still overbought, the dollar is undervalued, and the market continues to use every opportunity to buy the British currency and sell the dollar. It often ignores any unfavorable reports. The rare positive reports from the U.S., which appear from time to time, only lead to minor downward corrections.
On Wednesday, the pair may experience a slight pullback, but the uptrend is unlikely to be disrupted. Short positions can be maintained with a target of 1.2980-1.2993.
The key levels to consider on the 5M timeframe are 1.2547, 1.2605-1.2633, 1.2684-1.2693, 1.2748, 1.2791-1.2798, 1.2848-1.2860, 1.2913, 1.2980-1.2993, 1.3043, 1.3102-1.3107, 1.3145. On Wednesday, no major events are scheduled in the UK, and the U.S. will release the minutes from the latest Fed meeting, which is essentially a formality. Thus, there will be no significant news today.
1) The strength of a signal is determined by the time it takes for the signal to form (bounce or level breakthrough). The less time it took, the stronger the signal.
2) If two or more trades around a certain level are initiated based on false signals, subsequent signals from that level should be ignored.
3) In a flat market, any currency pair can form multiple false signals or none at all. In any case, it's better to stop trading at the first signs of a flat market.
4) Trades should be opened between the start of the European session and midway through the U.S. session. After this period, all trades must be closed manually.
5) In the hourly time frame, trades based on MACD signals are only advisable amidst substantial volatility and an established trend confirmed by a trendline or trend channel.
6) If two levels are too close to each other (5 to 20 pips), they should be considered support or resistance.
7) After moving 20 pips in the intended direction, the Stop Loss should be set to break even.
Support and Resistance price levels: targets for opening long or short positions. You can place Take Profit levels near them.
Red lines: channels or trend lines that depict the current trend and indicate the preferred trading direction.
The MACD (14,22,3) indicator, encompassing both the histogram and signal line, acts as an auxiliary tool and can also be used as a source of signals.
Important speeches and reports (always noted in the news calendar) can profoundly influence the movement of a currency pair. Hence, trading during their release calls for heightened caution. It may be reasonable to exit the market to prevent abrupt price reversals against the prevailing trend.
Beginners should always remember that not every trade will yield profit. Developing a clear strategy and effective money management is key to success in trading over a long period.
InstaForex analytical reviews will make you fully aware of market trends! Being an InstaForex client, you are provided with a large number of free services for efficient trading.

