 Stay
Stay 
Trading Conditions
Products
Tools


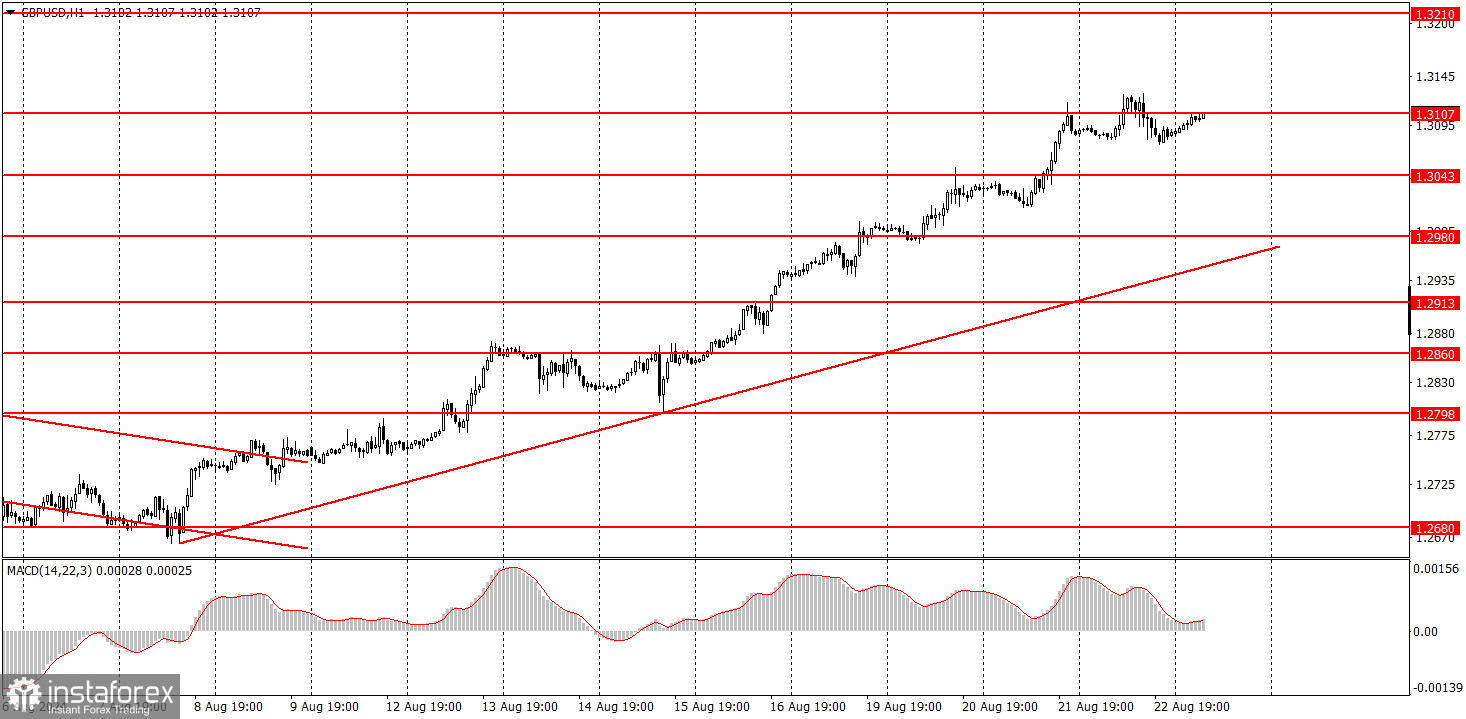
The GBP/USD pair experienced a minor decline on Thursday, but this drop is hardly noticeable on the charts. Thus, yesterday was just another day in a series where the British pound did not even manage to correct slightly, and the dollar did not gain. The upward trend remains intact and unquestionable. Yesterday, the UK released business activity indices for the services and manufacturing sectors, which came in above market forecasts. Isn't that a reason to buy the pair again?
Conversely, US business activity indices were mixed: manufacturing data was weaker than expected, while services data was stronger. Thus, the market had another reason to forgo buying the US dollar. Currently, the pair cannot correct downward even on technical grounds. If Federal Reserve Chair Jerome Powell delivers more dovish comments today, the US dollar may decline even further.
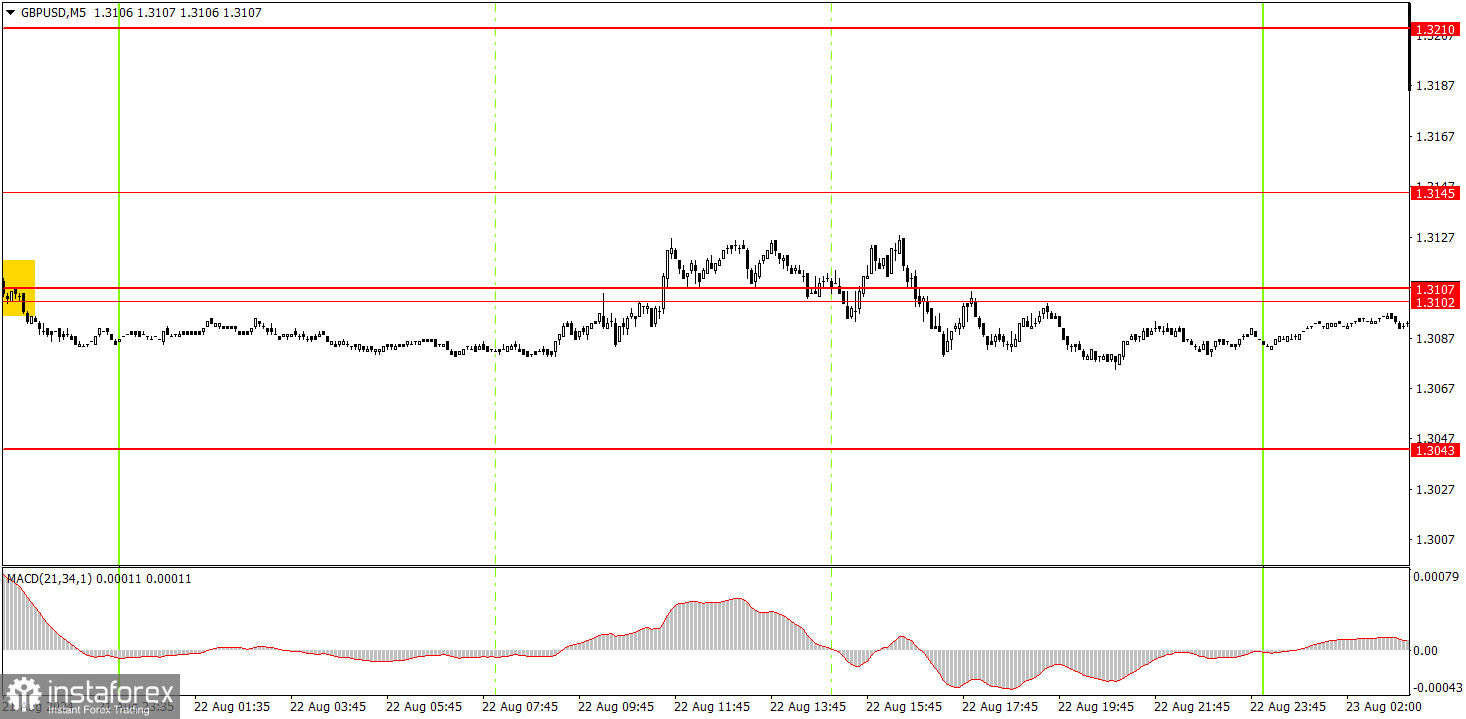
Thursday's movement in the 5-minute time frame was marked by chaos. There was no catalyst for new growth, and market participants currently don't desire to sell the pair. Therefore, we saw erratic movements throughout the day that resembled a typical flat. The price disregarded technical levels despite a good bounce from the 1.3102-1.3107 area the day before.
In the hourly time frame, GBP/USD has a good chance of sustaining the global downtrend, but currently, a local uptrend persists. The British pound is still overbought, the dollar is undervalued, and the market continues to use every opportunity to buy the British currency and sell the dollar. It often ignores any unfavorable reports. The rare positive reports from the US that occasionally appear lead to only minor downward corrections, and even those are not always the case.
On Friday, the pair might experience a slight decline, but the uptrend is unlikely to be disrupted. In the evening, increased volatility and movement in any direction can be expected, as no one knows what Powell will say at the Jackson Hole symposium.
The key levels to consider on the 5M timeframe are 1.2605-1.2633, 1.2684-1.2693, 1.2748, 1.2791-1.2798, 1.2848-1.2860, 1.2913, 1.2980-1.2993, 1.3043, 1.3102-1.3107, 1.3145, and 1.3210. Andrew Bailey and Powell will speak at the Jackson Hole symposium on Friday. These two events could provoke a significant market reaction.
1) The strength of a signal is determined by the time it takes for the signal to form (bounce or level breakthrough). The less time it took, the stronger the signal.
2) If two or more trades around a certain level are initiated based on false signals, subsequent signals from that level should be ignored.
3) In a flat market, any currency pair can form multiple false signals or none at all. In any case, it's better to stop trading at the first signs of a flat market.
4) Trades should be opened between the start of the European session and midway through the U.S. session. After this period, all trades must be closed manually.
5) In the hourly time frame, trades based on MACD signals are only advisable amidst substantial volatility and an established trend confirmed by a trendline or trend channel.
6) If two levels are too close to each other (5 to 20 pips), they should be considered support or resistance.
7) After moving 20 pips in the intended direction, the Stop Loss should be set to break even.
Support and Resistance price levels: targets for opening long or short positions. You can place Take Profit levels near them.
Red lines: channels or trend lines that depict the current trend and indicate the preferred trading direction.
The MACD (14,22,3) indicator, encompassing both the histogram and signal line, acts as an auxiliary tool and can also be used as a source of signals.
Important speeches and reports (always noted in the news calendar) can profoundly influence the movement of a currency pair. Hence, trading during their release calls for heightened caution. It may be reasonable to exit the market to prevent abrupt price reversals against the prevailing trend.
Beginners should always remember that not every trade will yield profit. Developing a clear strategy and effective money management is key to success in trading over a long period.
InstaForex analytical reviews will make you fully aware of market trends! Being an InstaForex client, you are provided with a large number of free services for efficient trading.

