 Stay
Stay 
Trading Conditions
Products
Tools


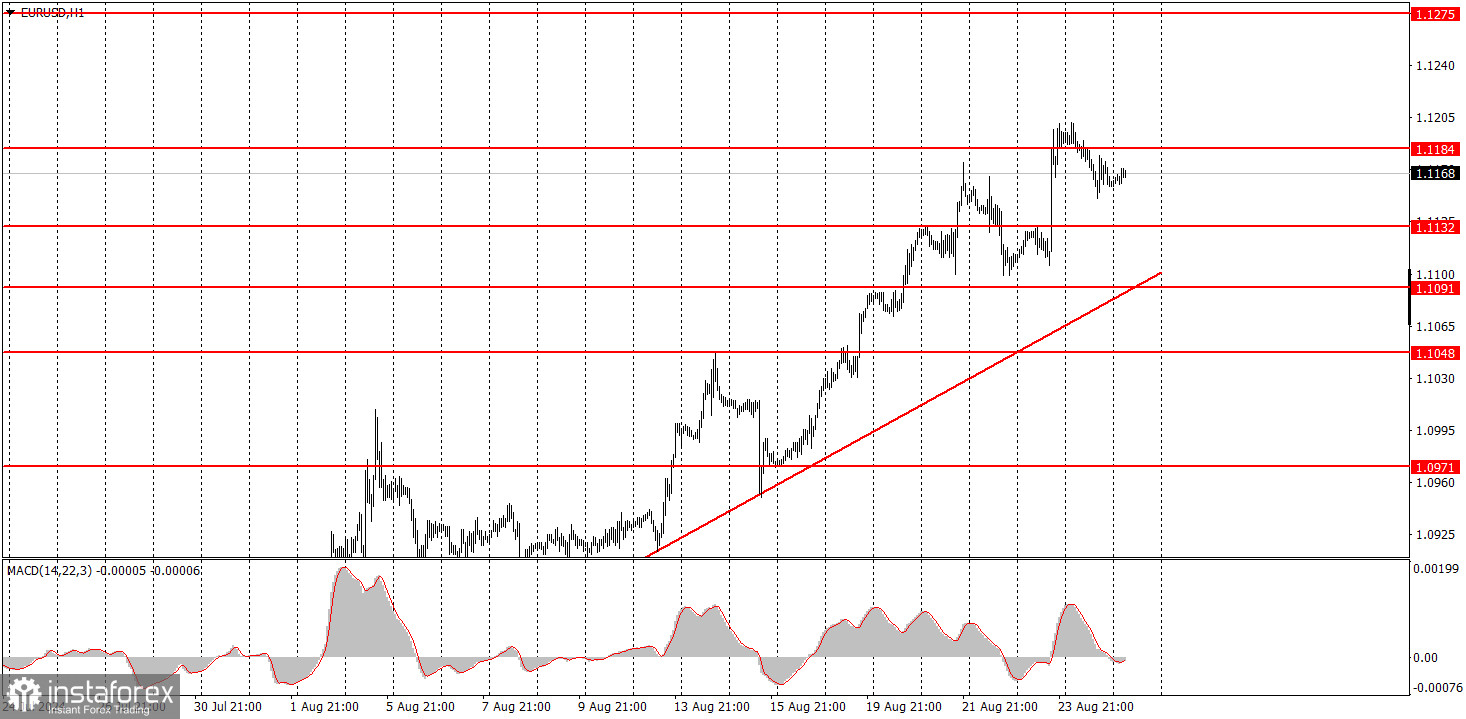
On Monday, the EUR/USD pair exhibited only a minor bearish correction but did so reluctantly. So far, it looks as if we will see another minor pullback, and then the main trend, which has been ongoing for several weeks, will resume. As we have mentioned, no compelling reasons exist for such a substantial decline in the American currency. The market is still reacting only to the factors that are convenient for it. It actively sells the dollar based on expectations of an interest rate cut by the Federal Reserve while completely ignoring the ongoing rate cuts by the European Central Bank. The market responds to every negative report from across the ocean and confidently disregards any other reports from the EU. Therefore, it's impossible to determine how long the upward trend will last, as it entirely depends on the mood and intentions of major market players.
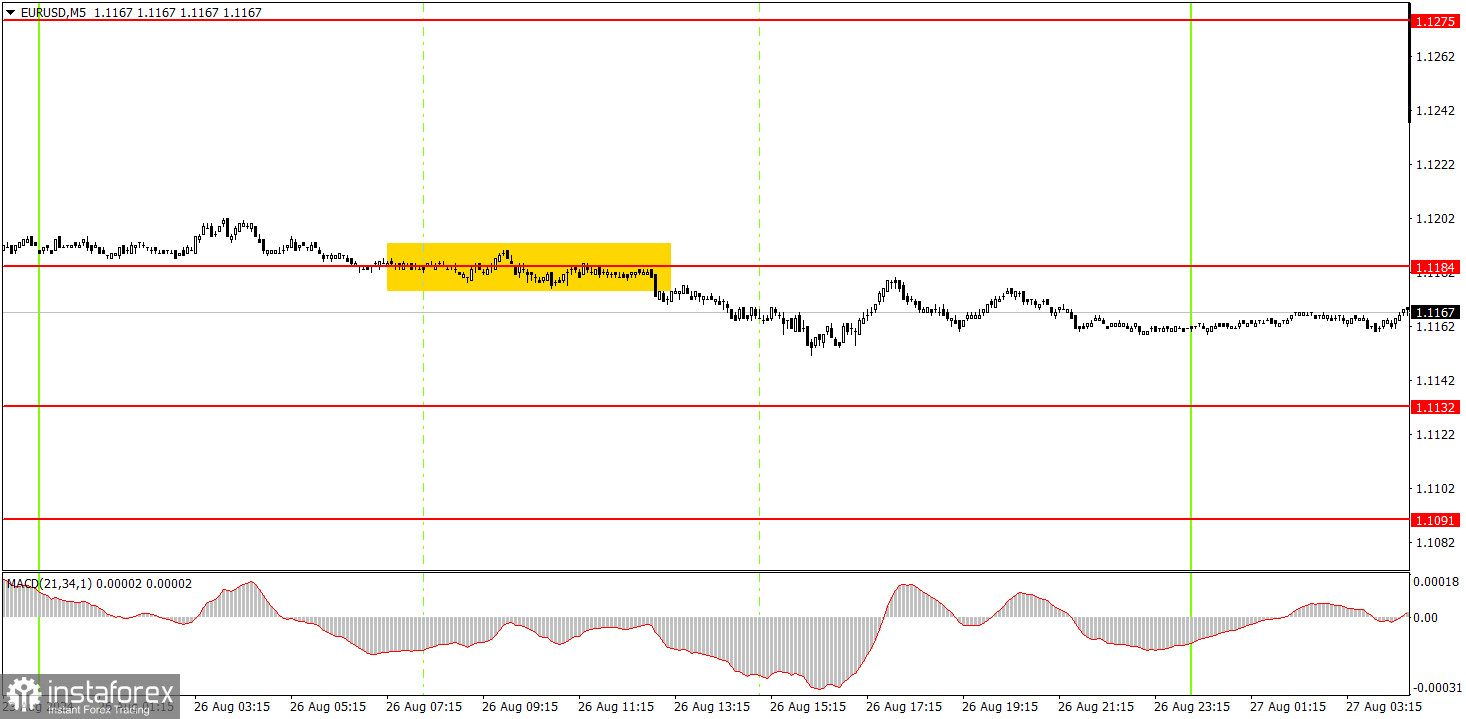
On Monday, one trading signal was formed in the 5-minute time frame. During the European session, the price traded around the 1.1184 level for a long time before eventually "peeling away" from it and starting a downward correction. However, if novice traders opened short positions, they were unlikely to profit from them. At the peak of the decline, the drop was 20 pips, and the price did not reach the nearest target. Therefore, the trade probably ended with a Stop Loss at breakeven.
EUR/USD continues to form an upward trend supported by a trend line in the hourly time frame. We believe the euro has fully factored in all the bullish factors, so we do not expect further upward movement. However, the market again shows it is ready to react to almost any event by panic selling the dollar. And if there are no events, it is prepared to sell the dollar for the sake of it. We can expect a drop in the pair after a breakout below the trend line.
On Tuesday, novice traders may anticipate a decline, as prices cannot rise indefinitely. However, it is important to understand that there is a solid upward trend. A slight decline can be expected if the price remains below 1.1184.
The key levels to consider on the 5M time frame are 1.0726-1.0733, 1.0797-1.0804, 1.0838-1.0856, 1.0888-1.0896, 1.0940, 1.0971, 1.1011, 1.1048, 1.1091, 1.1132, 1.1184, and 1.1275-1.1292. On Tuesday, Germany will release the third estimate of GDP, which is unlikely to impact market sentiment. It is a good opportunity for a slight downward correction, but we remember that the likelihood of further growth is much higher, and there is no need for specific reasons.
1) The strength of a signal is determined by the time it takes for the signal to form (bounce or level breakthrough). The less time it took, the stronger the signal.
2) If two or more trades around a certain level are initiated based on false signals, subsequent signals from that level should be ignored.
3) In a flat market, any currency pair can form multiple false signals or none at all. In any case, it's better to stop trading at the first signs of a flat market.
4) Trades should be opened between the start of the European session and midway through the U.S. session. After this period, all trades must be closed manually.
5) In the hourly time frame, trades based on MACD signals are only advisable amidst substantial volatility and an established trend confirmed by a trendline or trend channel.
6) If two levels are too close to each other (5 to 20 pips), they should be considered support or resistance.
7) After moving 15 pips in the intended direction, the Stop Loss should be set to break even.
Support and Resistance price levels: targets for opening long or short positions. You can place Take Profit levels near them.
Red lines: channels or trend lines that depict the current trend and indicate the preferred trading direction.
The MACD (14,22,3) indicator, encompassing both the histogram and signal line, acts as an auxiliary tool and can also be used as a source of signals.
Important speeches and reports (always noted in the news calendar) can profoundly influence the movement of a currency pair. Hence, trading during their release calls for heightened caution. It may be reasonable to exit the market to prevent abrupt price reversals against the prevailing trend.
Beginners should always remember that not every trade will yield profit. Developing a clear strategy and effective money management is key to success in trading over a long period.
InstaForex analytical reviews will make you fully aware of market trends! Being an InstaForex client, you are provided with a large number of free services for efficient trading.


