 Stay
Stay 
Trading Conditions
Products
Tools


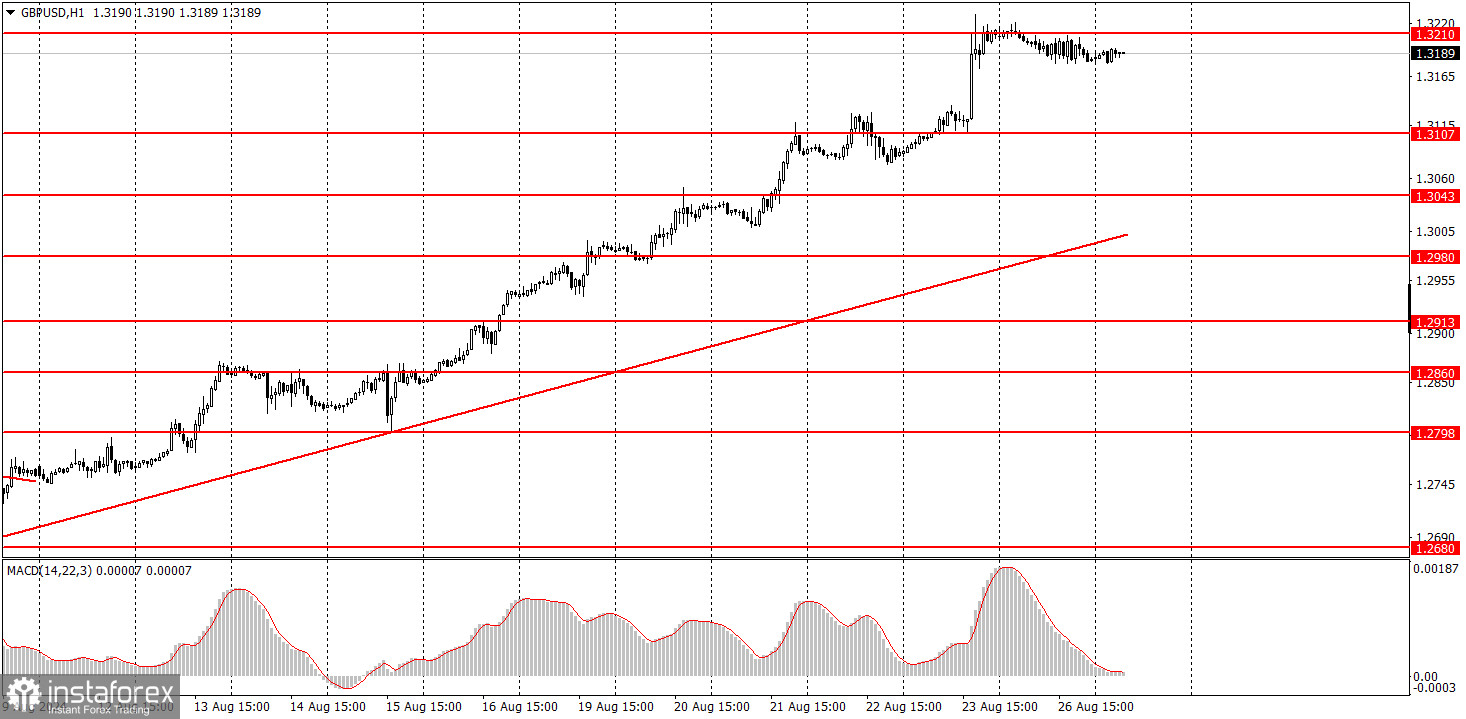
The GBP/USD pair moved in its usual style on Monday. After the British pound had grown by almost 600 pips without any pullbacks over just a couple of weeks, what kind of correction did we see? That's right, just 30 pips. What else can we talk about? By the way, even the macroeconomic backdrop supported the US dollar yesterday, as the only report of the day on durable goods orders was significantly stronger than forecasts—about twice as strong. What was the market's reaction to the positive US report? That's right, none. Thus, there is still no logic in the pair's movement. The upward trend persists, and the price could quickly resume its upward movement today. No reasons or grounds are needed for this. A decline in the British currency can only be expected after the price confirms a consolidation below the ascending trend line, but this may take a long time.
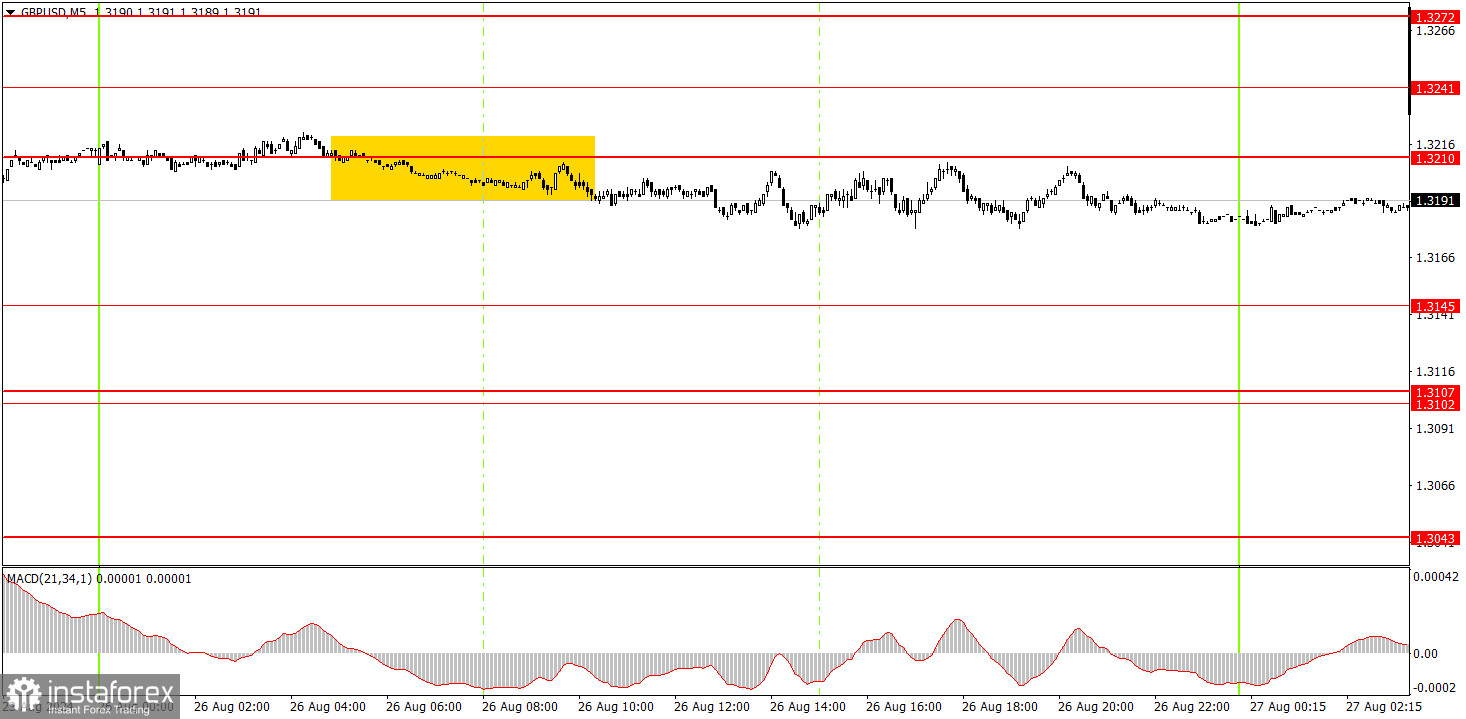
On Monday, a sell signal was generated in the 5-minute time frame, but what's the point if the price refuses to fall and the market refuses to sell? The pair fell only about 20 pips, and that was the end of the movement. The British pound moved more sideways than downward during the day. Perhaps the microscopic decline will continue today, but what can sellers hope for if the market rejects short positions?
In the hourly time frame, GBP/USD has a good chance of sustaining the global downward trend, but a local uptrend is currently in progress. The British pound is still overbought, the dollar is undervalued, and the market continues to use every opportunity to buy the British currency and sell the dollar. It often ignores any unfavorable reports and events.
On Tuesday, the pair may pull back slightly, but the uptrend is unlikely to end. The price bounced off the level of 1.3210 but refused to move downward. The most to expect is a few more pips down.
The key levels to consider on the 5M timeframe are 1.2605-1.2633, 1.2684-1.2693, 1.2748, 1.2791-1.2798, 1.2848-1.2860, 1.2913, 1.2980-1.2993, 1.3043, 1.3102-1.3107, 1.3145, and 1.3210. On Tuesday, the UK and US event calendar is completely empty. Therefore, below the level of 1.3210, expect a continuation of a weak downward correction and a resumption of the upward trend above this level.
1) The strength of a signal is determined by the time it takes for the signal to form (bounce or level breakthrough). The less time it took, the stronger the signal.
2) If two or more trades around a certain level are initiated based on false signals, subsequent signals from that level should be ignored.
3) In a flat market, any currency pair can form multiple false signals or none at all. In any case, it's better to stop trading at the first signs of a flat market.
4) Trades should be opened between the start of the European session and midway through the U.S. session. After this period, all trades must be closed manually.
5) In the hourly time frame, trades based on MACD signals are only advisable amidst substantial volatility and an established trend confirmed by a trendline or trend channel.
6) If two levels are too close to each other (5 to 20 pips), they should be considered support or resistance.
7) After moving 20 pips in the intended direction, the Stop Loss should be set to break even.
Support and Resistance price levels: targets for opening long or short positions. You can place Take Profit levels near them.
Red lines: channels or trend lines that depict the current trend and indicate the preferred trading direction.
The MACD (14,22,3) indicator, encompassing both the histogram and signal line, acts as an auxiliary tool and can also be used as a source of signals.
Important speeches and reports (always noted in the news calendar) can profoundly influence the movement of a currency pair. Hence, trading during their release calls for heightened caution. It may be reasonable to exit the market to prevent abrupt price reversals against the prevailing trend.
Beginners should always remember that not every trade will yield profit. Developing a clear strategy and effective money management is key to success in trading over a long period.
InstaForex analytical reviews will make you fully aware of market trends! Being an InstaForex client, you are provided with a large number of free services for efficient trading.


