 Stay
Stay 
Trading Conditions
Products
Tools


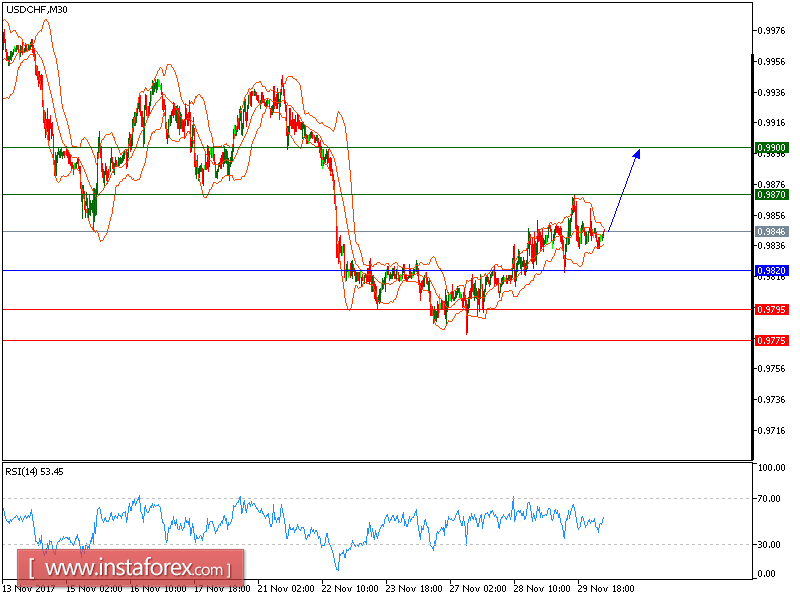
USD/CHF is expected to trade with a bullish outlook. The pair remains bullish above its key support at 0.9820. The relative strength index lacks downward momentum. Therefore, even though a consolidation cannot be ruled out, its extent should be very limited.
On the economic data front, the U.S. Commerce Department reported that GDP grew 3.3% on quarter in the third quarter, the fastest pace since the third quarter of 2014, compared with +3.0% previously estimated and +3.1% in the second quarter. The Federal Reserve's beige book report pointed out that economic activity expanded at a "modest to moderate pace" in recent weeks amid signs of rising prices and ongoing strength in labor markets. Also, in her final testimony to Congress, Federal Reserve Chairwoman Janet Yellen said, "The economic expansion is increasingly broad-based across sectors as well as across much of the global economy." Meanwhile, the National Association of Realtors reported that its pending home sales index rose 3.5% on month to 109.3 in October, compared with +1.4% expected.
As long as 0.9820 holds on the downside, look for a new rise to 0.9870 & 0.9900 in extension.
Chart Explanation: The black line shows the pivot point. The present price above the pivot point indicates a bullish position, and the price below the pivot points indicates a short position. The red lines show the support levels and the green line indicates the resistance levels. These levels can be used to enter and exit trades.
Strategy: BUY, Stop Loss: 0.9820, Take Profit: 0.9870
Resistance levels: 0.9870, 0.9900, and 0.9935
Support levels: 0.9795, 0.9775, and 0.9720
InstaForex analytical reviews will make you fully aware of market trends! Being an InstaForex client, you are provided with a large number of free services for efficient trading.

