 Stay
Stay 
Trading Conditions
Products
Tools


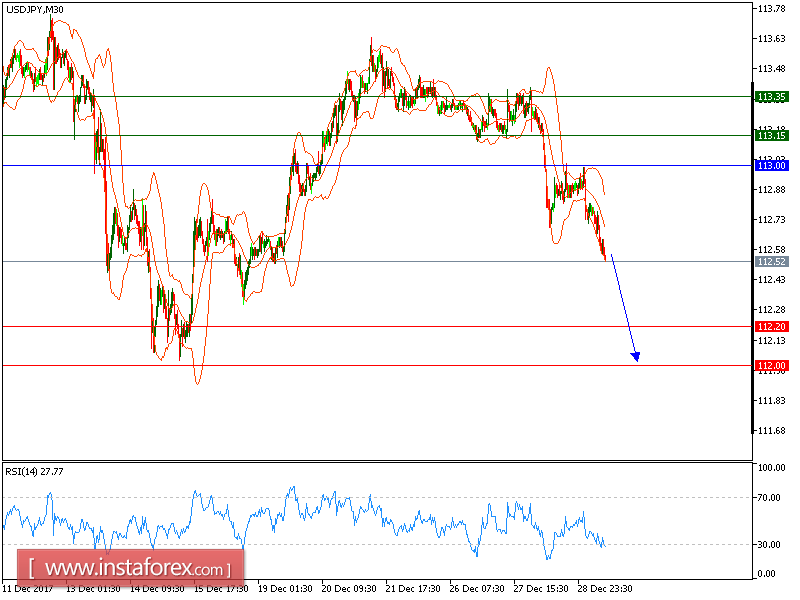
All our downside target which we predicted in yesterday's analysis have been hit. Despite of recent rebound from 112.65 (the low of December 28), the pair is still capped by a declining 50-period moving average. The relative strength index is below its neutrality level at 50. Even though a continuation of the technical rebound cannot be ruled out, its extent should be limited. To conclude, below 113.00, look for a further decline with targets at 112.20 and 112.00 in extension.
Alternatively, if the price moves in the opposite direction, a long position is recommended above 113.00 with a target of 113.15.
Chart Explanation: The black line shows the pivot point. The current price above the pivot point indicates a bullish position, while the price below the pivot point is a signal for a short position. The red lines show the support levels and the green line indicates the resistance level. These levels can be used to enter and exit trades.
Strategy: SELL, Stop Loss: 113.00, Take Profit: 112.20
Resistance levels: 113.15, 113.35 and 113.85 Support Levels: 112.20, 112.00, 111.70
InstaForex analytical reviews will make you fully aware of market trends! Being an InstaForex client, you are provided with a large number of free services for efficient trading.

