 Stay
Stay 
Trading Conditions
Products
Tools


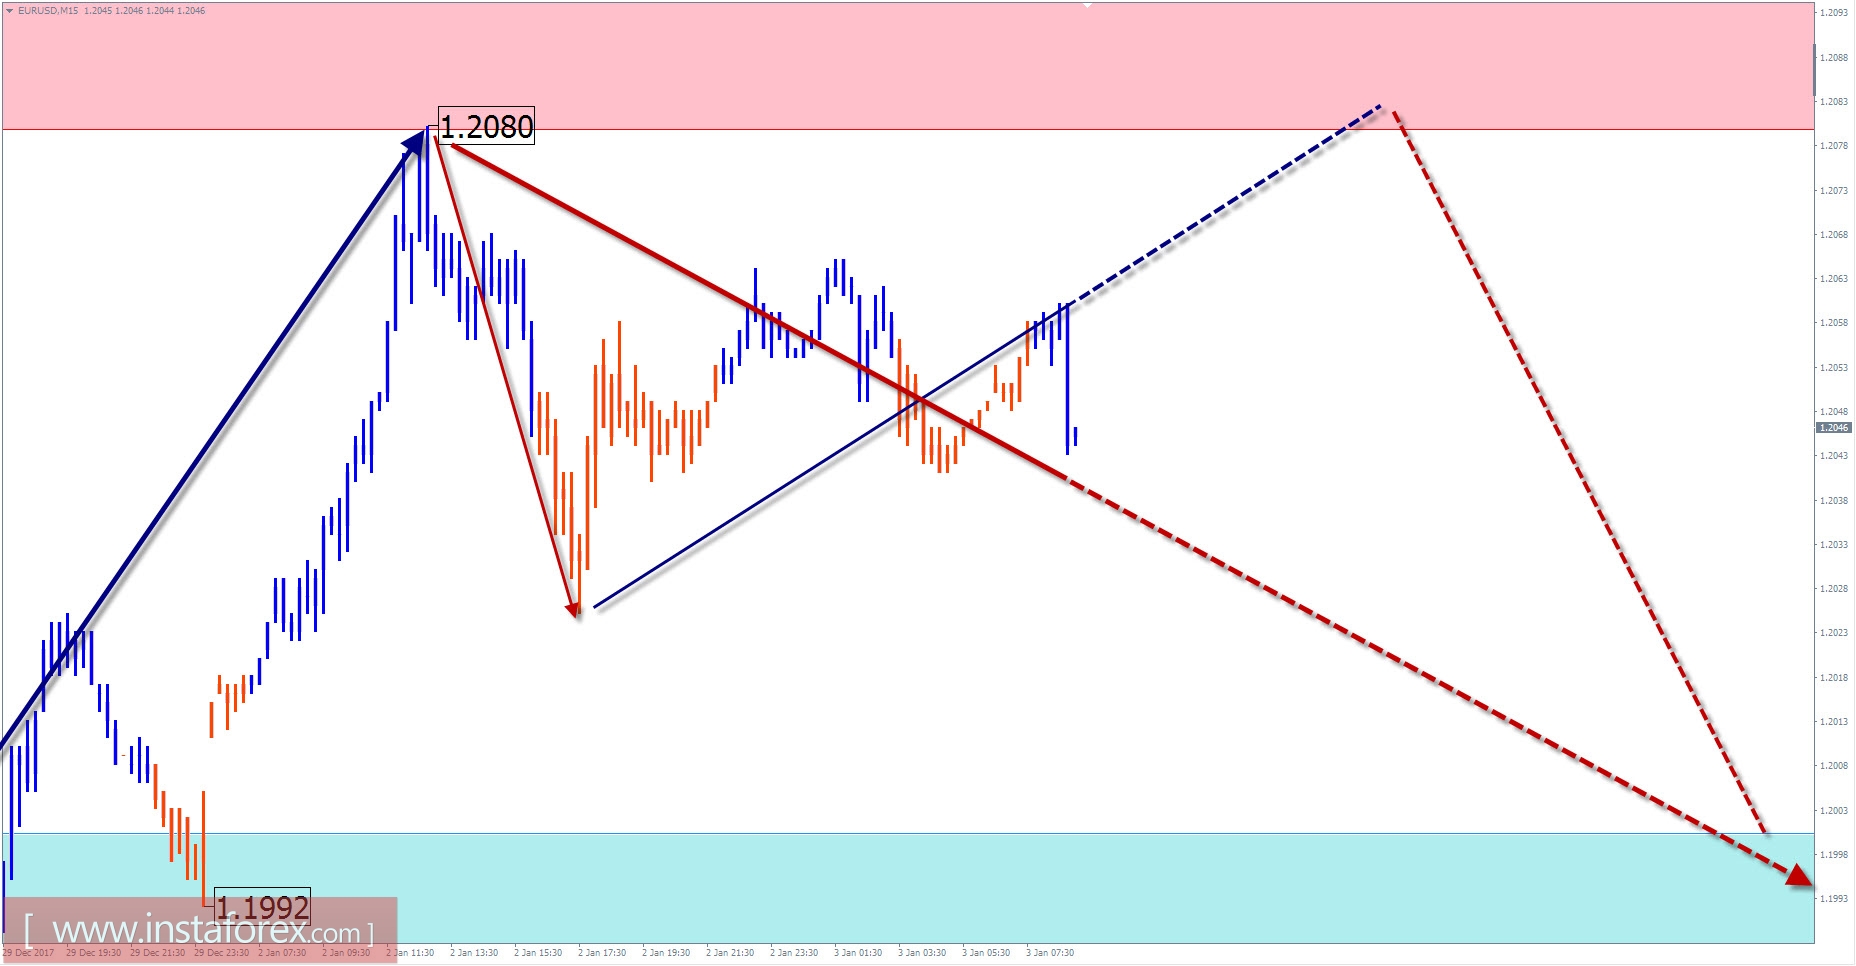
Overview and forecast for EUR / USD
The graph of the European currency in the main pair against the dollar after the correction period resumed its growth. The quotes of the pair reached a critical point again, which divides the two main options for the future scenario. In the first case, the current stretched plane of large scale will be continued further. An alternative option involves pre-shaping the correction at a higher wave level.
Today is probably the end of the rise of the past days. Turning is not expected above the resistance zone levels. At the beginning of the course of the price down can be calculated in the second half of the day. The lower limit of the daily course of the pair is the settlement support.
The boundaries of the resistance zones:
- 1.2080 / 1.2110
The boundaries of the support zone:
- 1.2000 / 1.1970
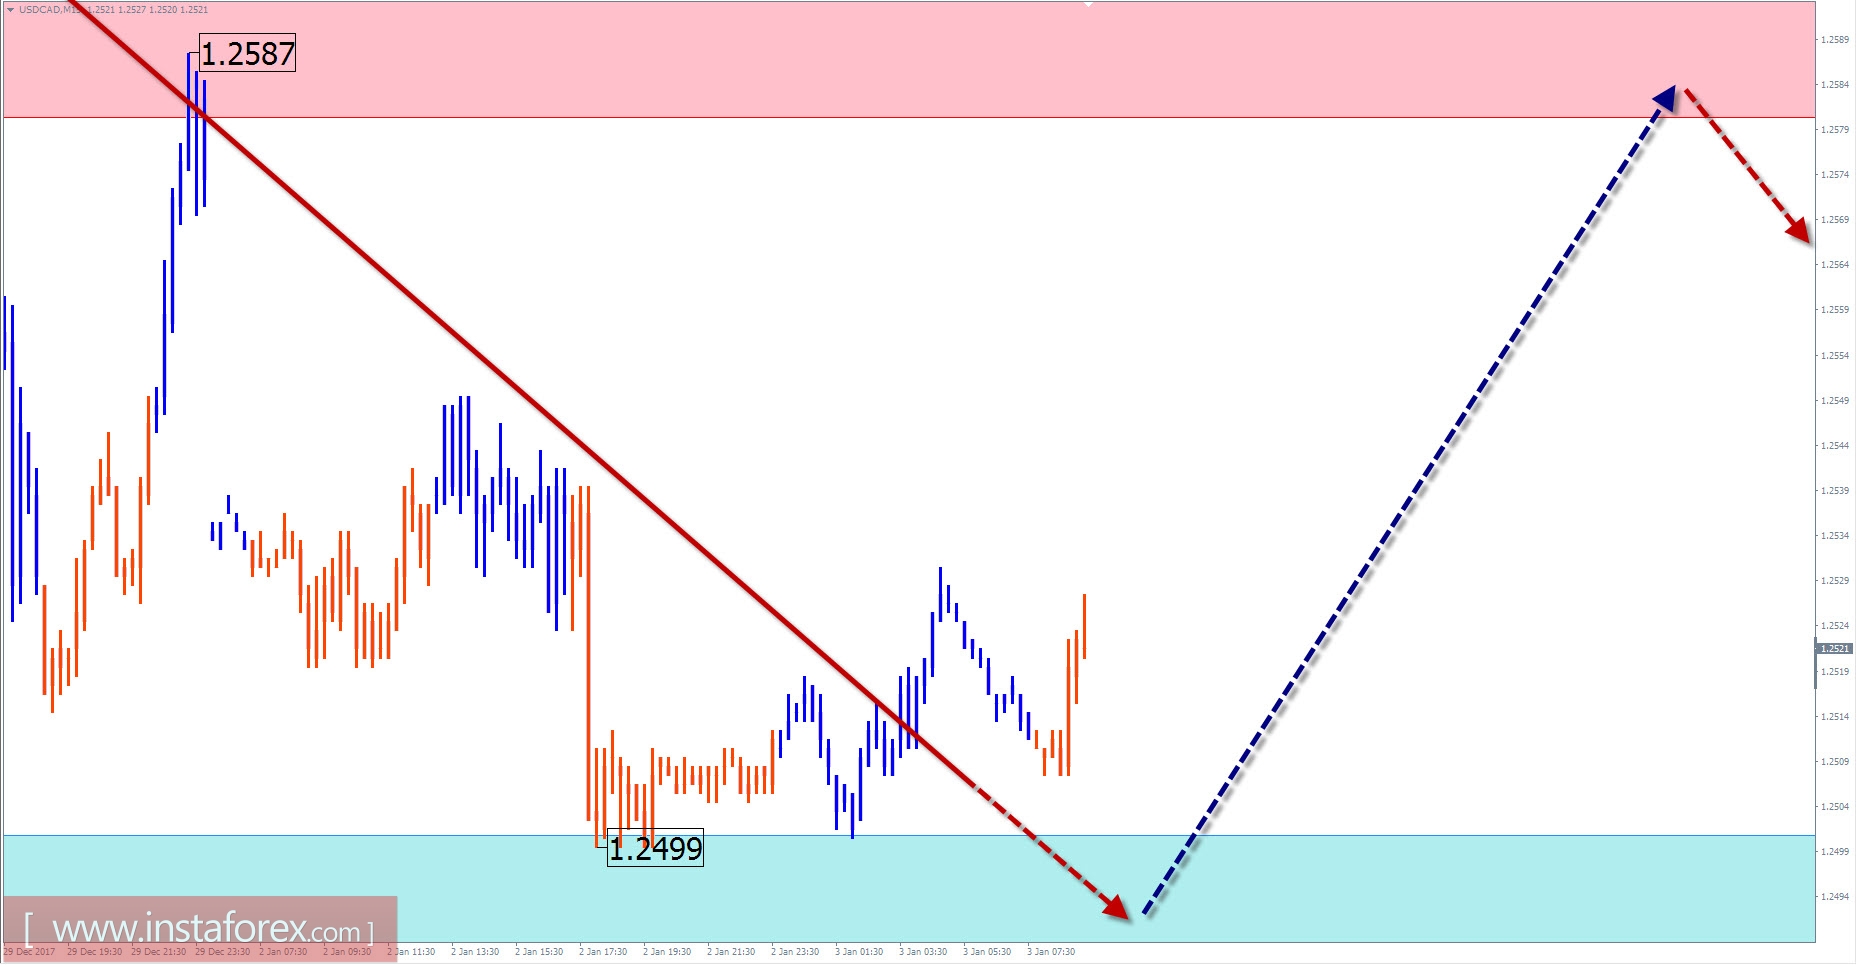
Overview and forecast for USD / CAD
The direction of the short-term trend on the chart of the major pair of the Canadian dollar is set by the upward wave of September 8 last year. During the last 2 months, the price is adjusted, forming a wave zigzag. The preliminary calculation of the target zone gives, as the nearest landmark of the completion of the wave, the mid-hundred, and twenty-fifth price pattern.
Today, the formation of a corrective rollback is likely. The flute nature of price fluctuations will become dominant. The swing upwards limits the calculated resistance zone.
Then you should wait for a return to the main course of the movement and a new section for strengthening the Canadian currency.
The boundaries of the resistance zones:
- 1.2580 / 1.2610
The boundaries of the support zones:
- 1.2500 / 1.2470
Explanations to the figures: For simplified wave analysis, the simplest type of wave is used in the form of a zigzag, combining 3 parts (A; B; C). Of these waves, all kinds of correction are composed and most of the impulses. At each time frame, the last, incomplete wave is analyzed.
The areas marked on the graphs are indicated by the calculation areas, where the probability of a change in the direction of motion is significantly increased. Arrows indicate the wave counting according to the technique used by the author. The solid background of the arrows indicates the structure formed, the dotted one indicates the expected wave motion.
Attention: The wave algorithm does not take into account the duration of the tool movements in time. The forecast is not a trading signal! To conduct a trade transaction, you need to confirm the signals of your trading systems.
InstaForex analytical reviews will make you fully aware of market trends! Being an InstaForex client, you are provided with a large number of free services for efficient trading.


