 Stay
Stay 
Trading Conditions
Products
Tools


Technically trend remains bearish in JPM as price continues making lower lows and lower highs. However current price formation gives hopes to bulls that not long from now we will see an upward reversal in JPM.
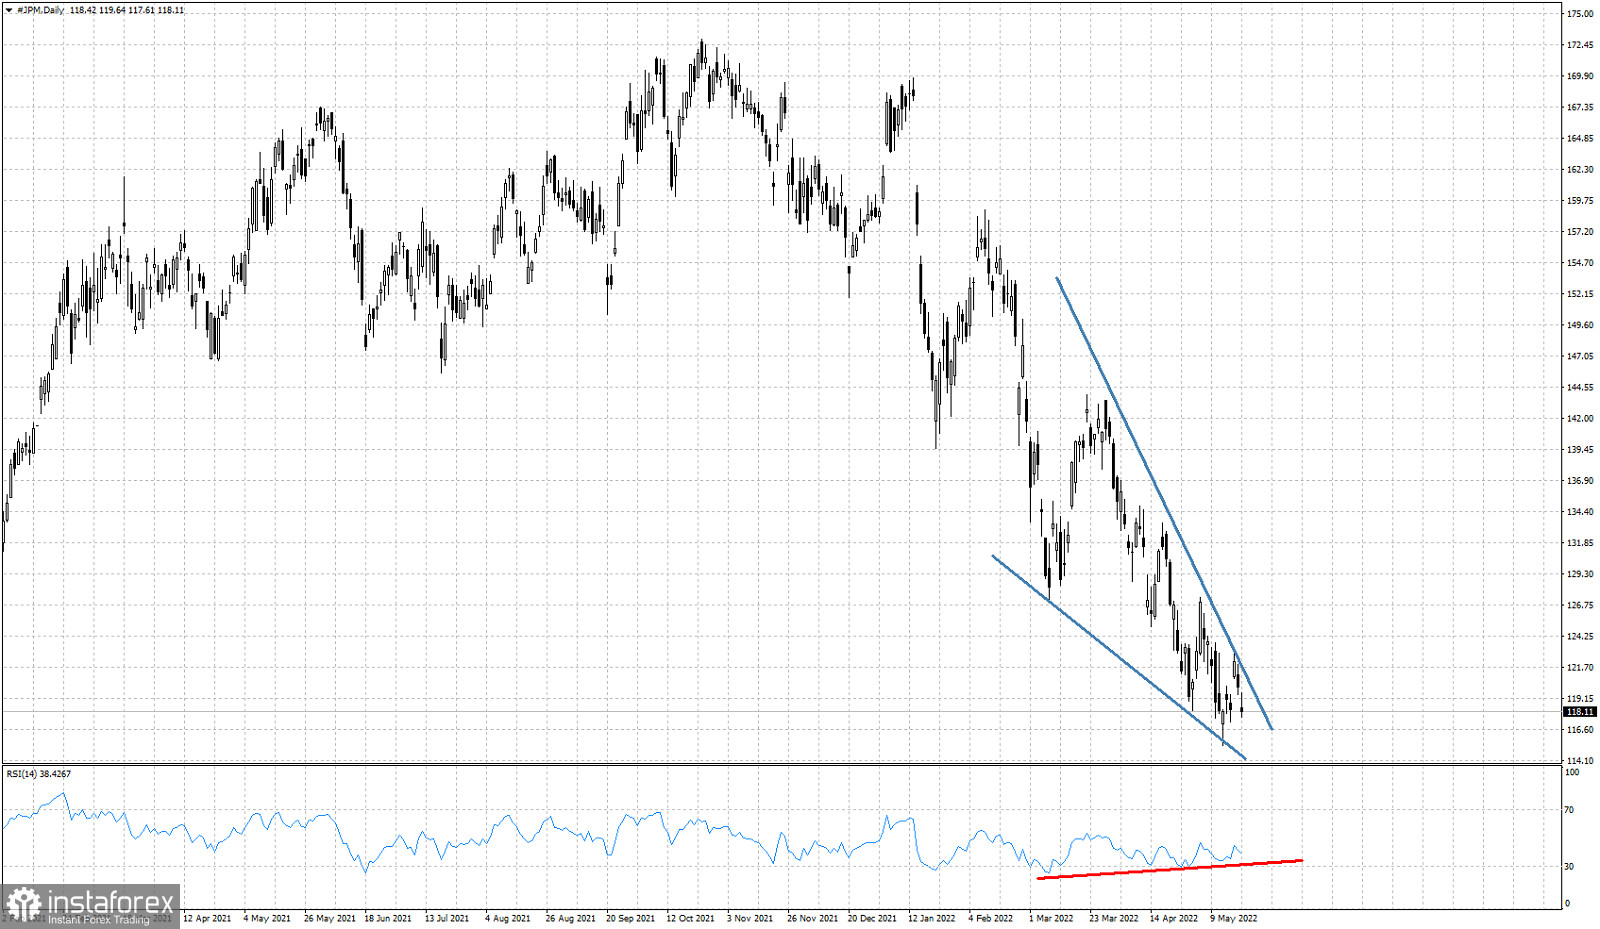
Red line - bullish RSI divergence
In the Daily chart of JPM stock, price has formed a bullish wedge pattern. Resistance by the upper wedge boundary is at $121.50. A break above this level would be a sign of strength. The RSI is divergence as it is making higher lows in contrast to price making lower lows. This bullish divergence is not a reversal signal, but only a warning that the downtrend is weakening. So traders need to be cautious as the chances of a reversal have increased.
InstaForex analytical reviews will make you fully aware of market trends! Being an InstaForex client, you are provided with a large number of free services for efficient trading.
Your IP address shows that you are currently located in the USA. If you are a resident of the United States, you are prohibited from using the services of Instant Trading EU Ltd including online trading, online transfers, deposit/withdrawal of funds, etc.
If you think you are seeing this message by mistake and your location is not the US, kindly proceed to the website. Otherwise, you must leave the website in order to comply with government restrictions.
Why does your IP address show your location as the USA?
Please confirm whether you are a US resident or not by clicking the relevant button below. If you choose the wrong option, being a US resident, you will not be able to open an account with InstaForex anyway.
We are sorry for any inconvenience caused by this message.


