 Stay
Stay 
Trading Conditions
Products
Tools


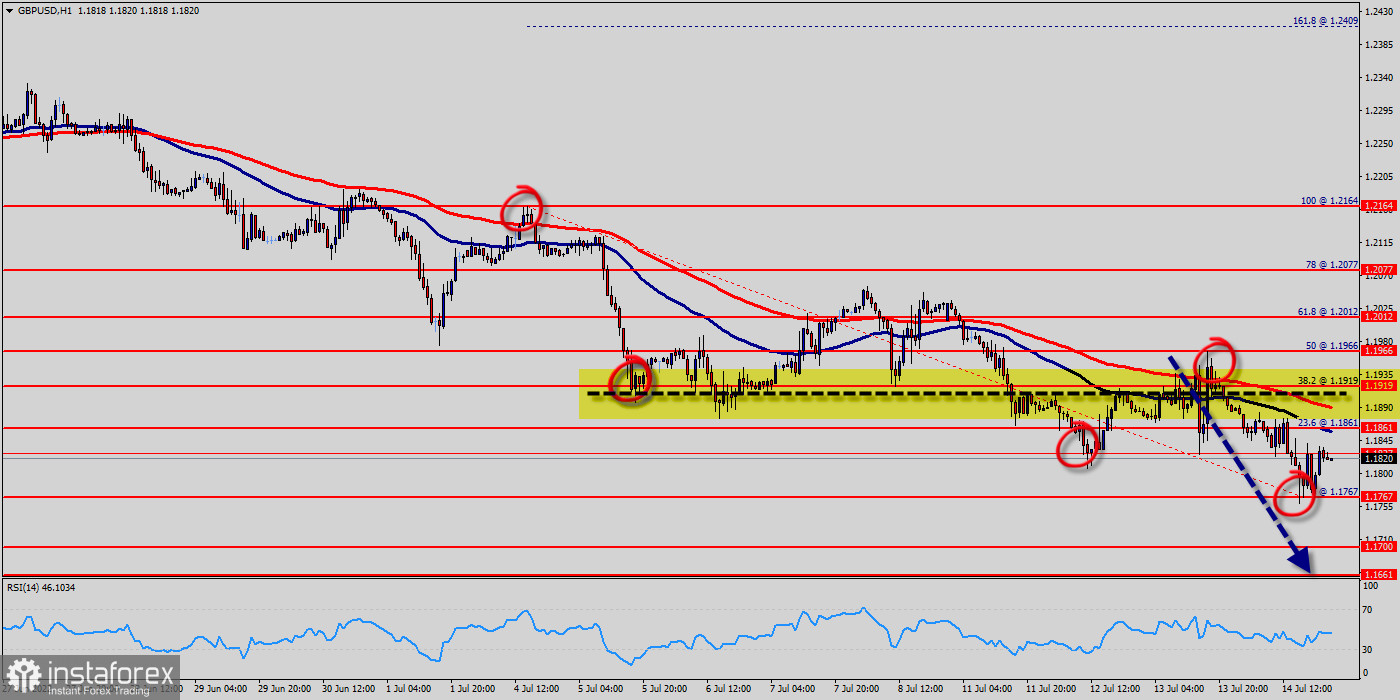
The GBP/USD pair dropped from the level of 1.1966 to the bottom around 1.1767. But the pair has rebounded from the bottom of 1.1767 to close at 1.1820. Today, the first support level is seen at 1.1767, and the price is moving in a bearish channel now. Furthermore, the price as been set below the strong resistance at the level of 1.1966 , which coincides with the 50% Fibonacci retracement level. This resistance has been rejected several times confirming the downtrend. Additionally, the RSI starts signaling a downward trend. As a result, if the GBP/USD pair is able to break out the first support at 1.1767, the market will decline further to 1.1700 in order to test the weekly support 2. The pair will probably go down because the downtrend is still strong. Consequently, the market is likely to show signs of a bearish trend. The strong resistance is seen at the level of 1.1861 because it represents the weekly resistance 1. Equally important, the RSI and the moving average (100) are still calling for a downtrend. Therefore, the market indicates a bearish opportunity at the level of 1.1861 in the H1 chart. So, it will be good to sell below the level of 1.1861 with the first target at 1.1767 and further to 1.1700. At the same time, the breakup of 1.1966 will allow the pair to go further up to the levels of 1.2077 in order to retest the weekly resistance 2. Always rememebr that the market analysis posted here is meant to increase your awareness, but not to give instructions to make a trade.
Forecast (GBP/USD) :
The volatility is very high for that the GBP/USD is still moving between 1.1861 and 1.1700 in coming hours. Consequently, the market is likely to show signs of a bearish trend again. Hence, it will be good to sell below the level of 1.1861 with the first target at 1.1767 and further to 1.1700 in order to test the daily support 2. However, if the GBP/USD is able to break out the daily support at 1.1966, the market will rise further to 1.2077 to approach support 2 next week.
InstaForex analytical reviews will make you fully aware of market trends! Being an InstaForex client, you are provided with a large number of free services for efficient trading.

