 Stay
Stay 
Trading Conditions
Products
Tools


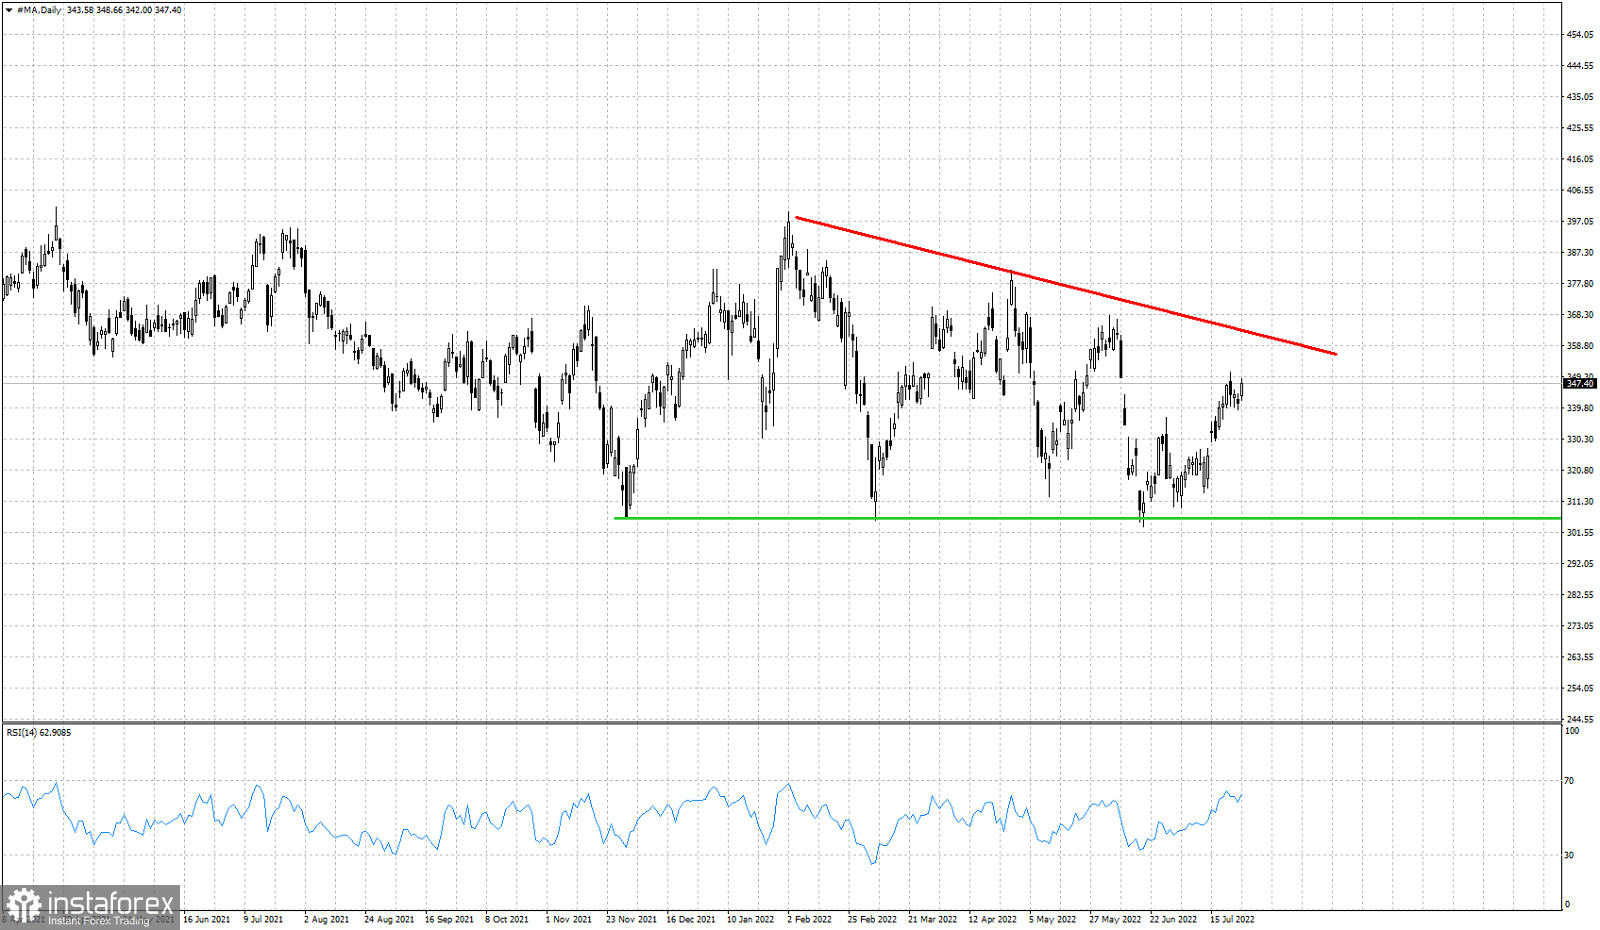
Red line- resistance trend line
Green line- horizontal support
MA stock price is in an bullish momentum after bottoming in mid June around $306 where we find the major horizontal support. In previous posts we noted the descending triangle formation MA stock price is in. Price has respected support at $306 and is bouncing higher towards the resistance of the triangle formation. MA stock price is making higher highs and higher lows in the Daily chart. Price remains below the red downward sloping resistance trend line. Will we see another lower high and rejection at the red trend line? If this is the case, then we should expect MA stock price to return towards the green horizontal support. The area around the red trend line resistance at $360, is key resistance and a very good level to open short positions.
InstaForex analytical reviews will make you fully aware of market trends! Being an InstaForex client, you are provided with a large number of free services for efficient trading.
Your IP address shows that you are currently located in the USA. If you are a resident of the United States, you are prohibited from using the services of Instant Trading EU Ltd including online trading, online transfers, deposit/withdrawal of funds, etc.
If you think you are seeing this message by mistake and your location is not the US, kindly proceed to the website. Otherwise, you must leave the website in order to comply with government restrictions.
Why does your IP address show your location as the USA?
Please confirm whether you are a US resident or not by clicking the relevant button below. If you choose the wrong option, being a US resident, you will not be able to open an account with InstaForex anyway.
We are sorry for any inconvenience caused by this message.


