empty
 
 
You are about to leave
www.instaforex.eu >
a website operated by
INSTANT TRADING EU LTD
Open Account

16.08.202216:38 Forex Analysis & Reviews: MA stock price testing important resistance area.

This information is provided to retail and professional clients as part of marketing communication. It does not contain and should not be construed as containing investment advice or investment recommendation or an offer or solicitation to engage in any transaction or strategy in financial instruments. Past performance is not a guarantee or prediction of future performance. Instant Trading EU Ltd. makes no representation and assumes no liability as to the accuracy or completeness of the information provided, or any loss arising from any investment based on analysis, forecast or other information provided by an employee of the Company or otherwise. Full disclaimer is available here.

Exchange Rates 16.08.2022 analysis

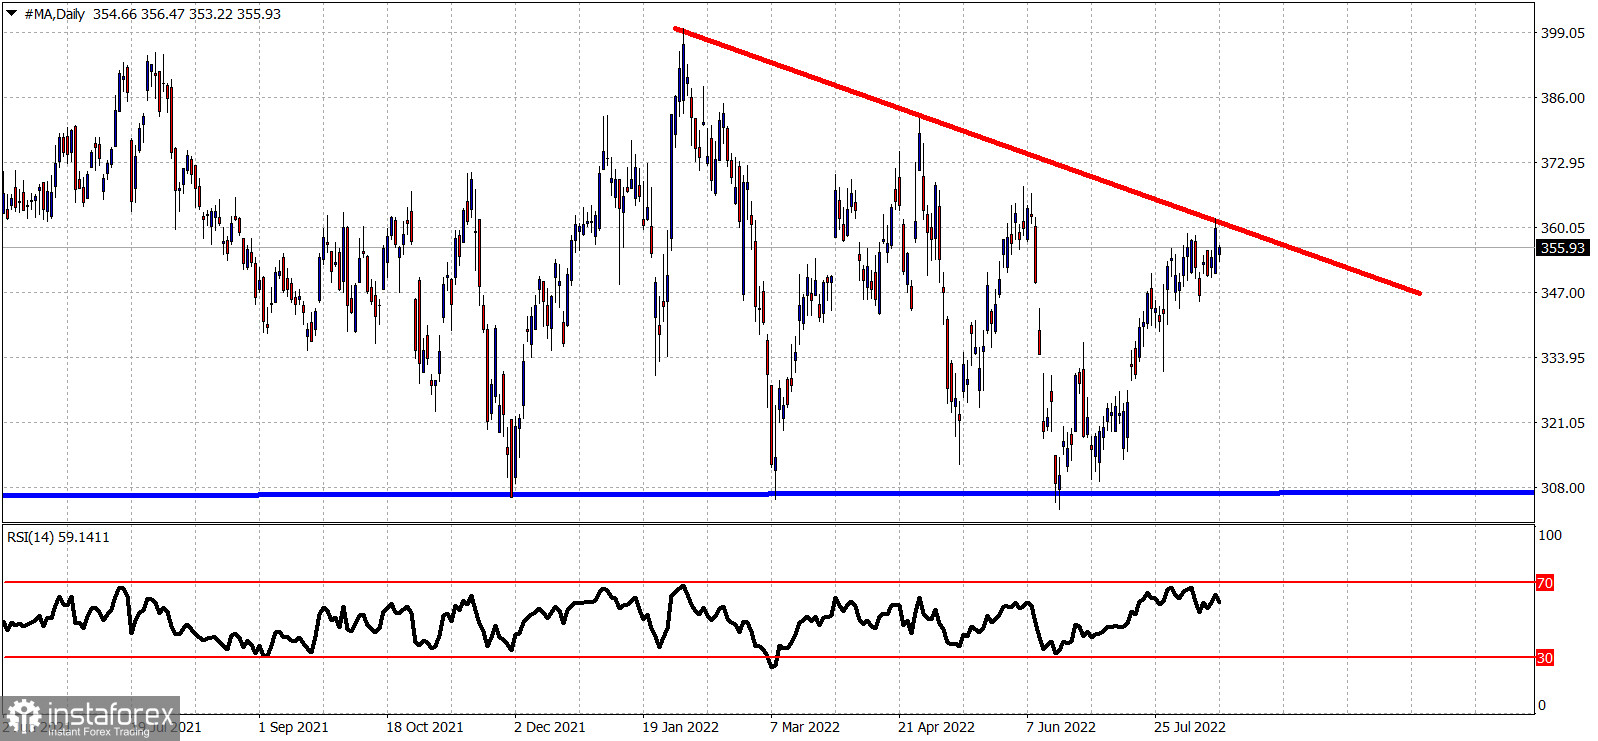
Red line -resistance

Blue line- horizontal support

MA stock price has reached the resistance area around $360 as expected by our earlier analysis at the end of July. Price is testing the upper part of the descending triangle pattern. This is major resistance. The RSI is making lower highs as price is making higher highs. There are increased chances we see another rejection at current levels or a little bit higher. There are increased chances we see another downward move towards $306. Bulls need to be very cautious. Support is at $346. A break below this level will increase chances of a move lower towards $300.

Alexandros Yfantis
Analytical expert of InstaForex
© 2007-2024

Open trading account

InstaForex analytical reviews will make you fully aware of market trends! Being an InstaForex client, you are provided with a large number of free services for efficient trading.


You are now leaving www.instaforex.eu, a website operated by INSTANT TRADING EU LTD
Can't speak right now?
Ask your question in the chat.

Turn "Do Not Track" off