 Stay
Stay 
Trading Conditions
Products
Tools

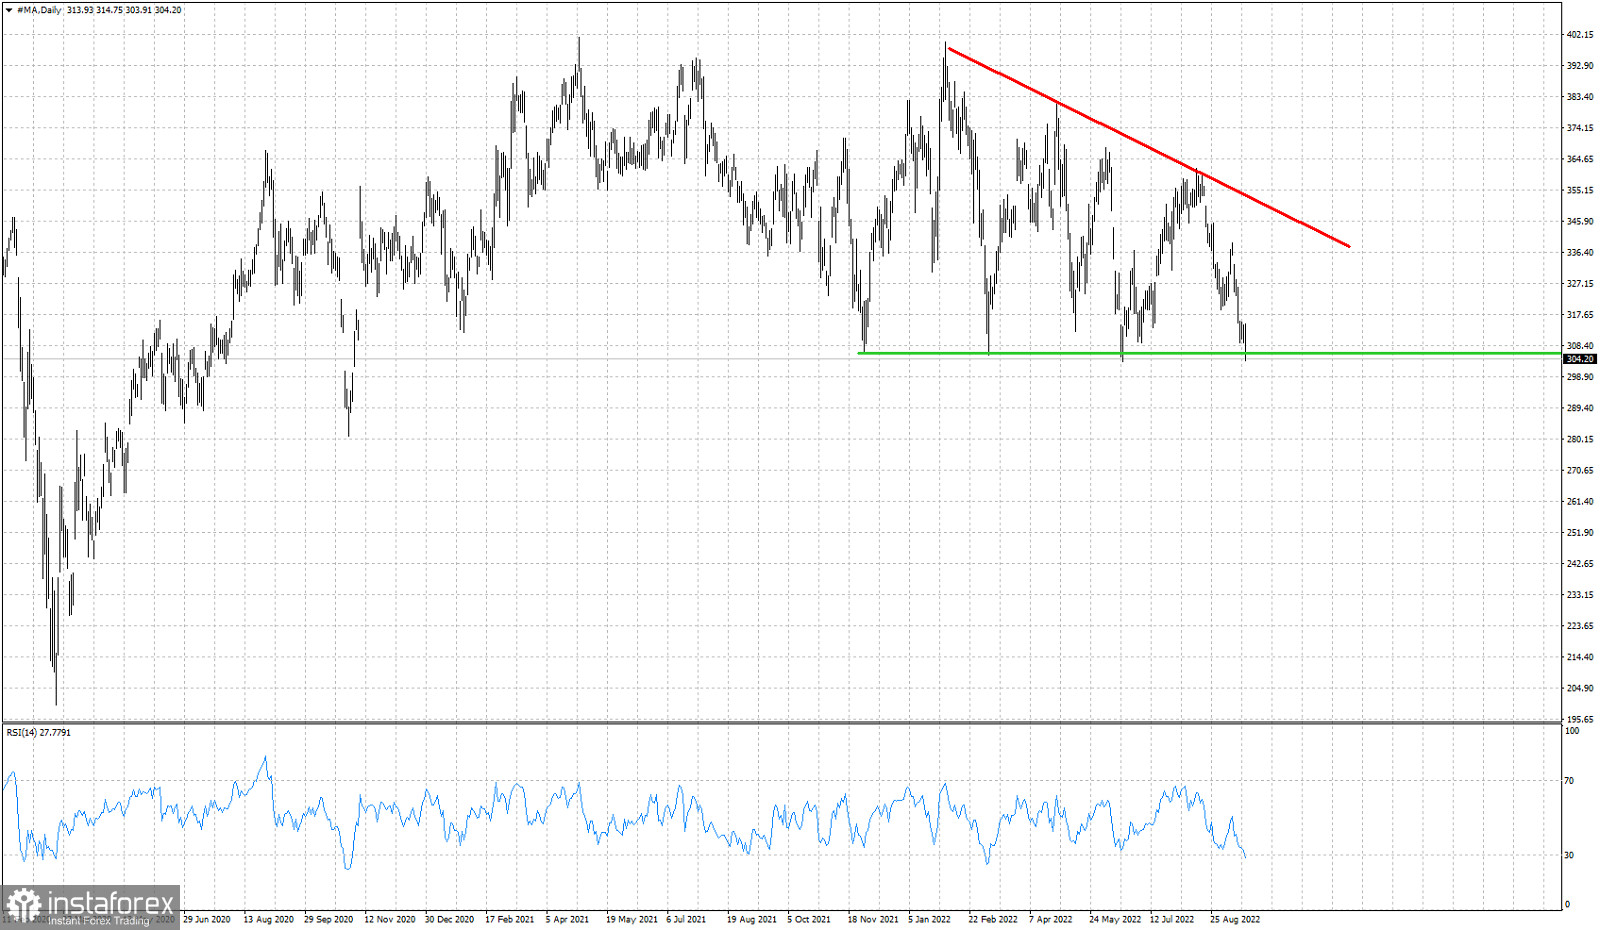
Red line- resistance
Green line - support
When MA stock price was trading around $365 we warned traders that the descending bearish triangle pattern and the rejection at the upper triangle resistance, would lead to a move back towards the support of $306-$300. Back in August our analysis warned traders of the increased chances of such a pull back towards $300. A break below the green horizontal support trend line would be an important bearish signal that could push price towards $200. If support holds, it is very likely that bulls manage to push MA stock price towards the red resistance trend line at $340-45.
InstaForex analytical reviews will make you fully aware of market trends! Being an InstaForex client, you are provided with a large number of free services for efficient trading.


