 Stay
Stay 
Trading Conditions
Products
Tools


Breaking news from the crypto space:
What is the probability of BTC/USD falling to the level of $ 30,000? In contrast to bullish expectations this year, the prices of Bitcoin continue to decline. Now that the first cryptocurrency is hovering around $ 40,000, market participants are asking themselves the same question: where will the price be more likely to move – to $ 50,000 or $ 30,000? If Bitcoin closes the week below $ 40,000, there will be a chance of testing support at $ 30,000 in the medium term. In turn, a decisive reversal around the $ 40,000 level could support BTC's rally.
It can be seen that the movement is very similar to the price's behavior in February-May last year when it reached four highs and the relative strength index formed lower highs. Four price highs with lows highs, together with the RSI mimicking a similar downward trend, triggered a decline in BTC to $ 30,000 last May.
Now, let's continue to consider Bitcoin from the viewpoint of the Elliott theory on the hourly timeframe.
BTC/USD, H1 timeframe:
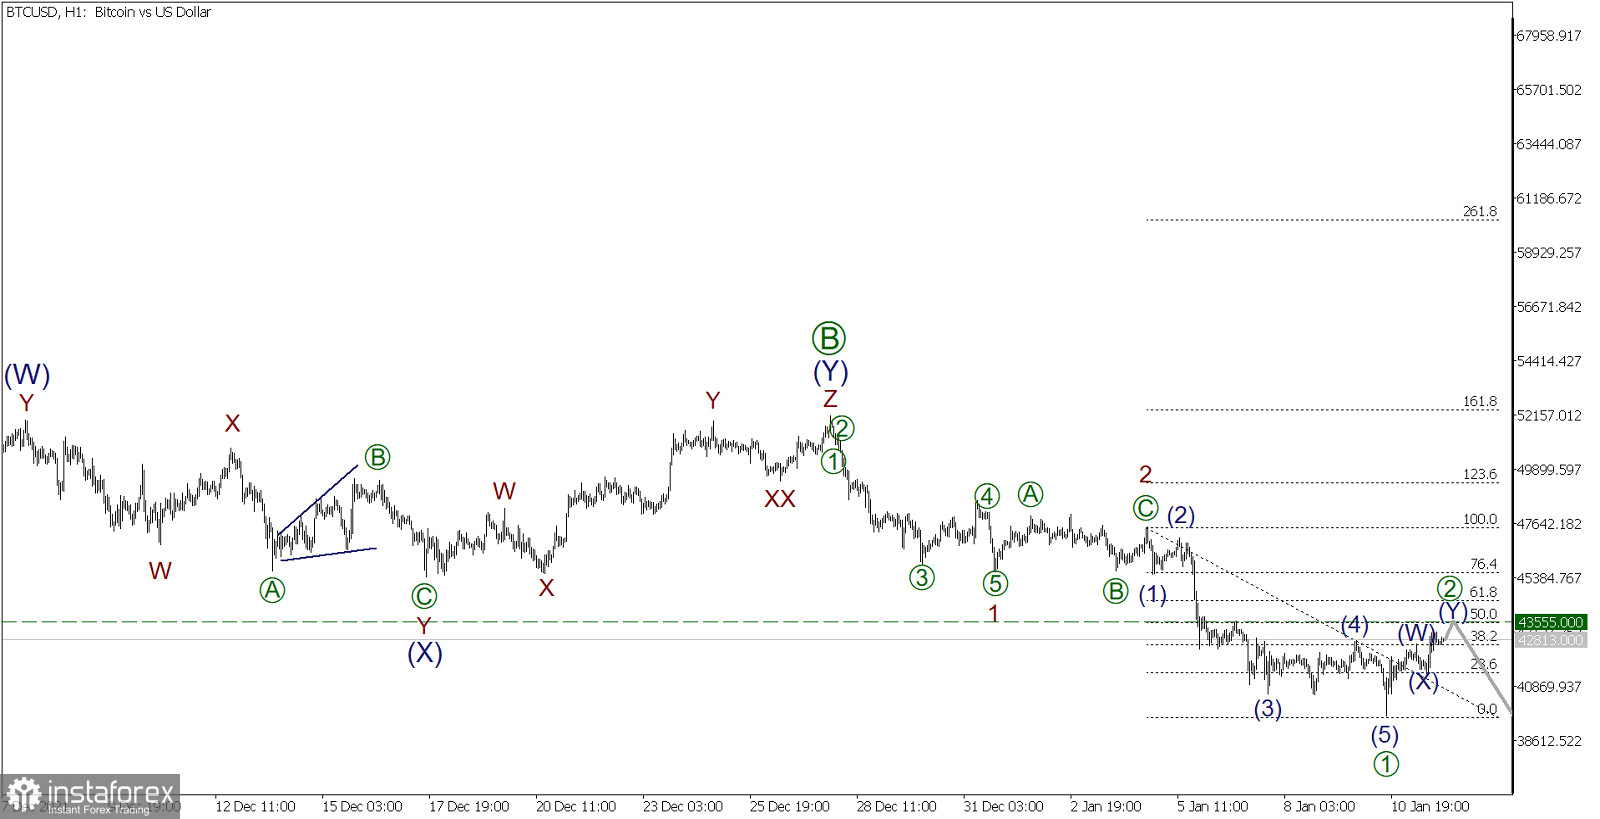
To confirm the above information, let's see the wave analysis of the cryptocurrency pair. It can be seen that a downward trend is being built in the market. According to Elliott's theory, a large bearish zigzag [A]-[B]-[C] is formed, in which the correction wave [B], which is its middle part, was completed. Now, we see the formation of the initial part of the final wave [C].
The initial part of wave [C] hints at an impulse. Currently, sub-waves 1 and 2 are already done. The third impulse sub-wave is in the process of development, which is expected to be stronger than the previous two sub-waves.
Most likely, the price completed the development of the downward sub-wave [1], which took the form of an impulse (1)-(2)-(3)-(4)-(5), and then began to build an upward correction [2] to this impulse.
Moreover, it seems that the correctional wave [2] is almost completed. It looks like a double zigzag (W)-(X)-(Y), which may end around the level of 43555.00l. At this level, the value of wave [2] will be 50% along the Fibonacci lines of the impulse [1].
The probability of reaching this level is high. Bitcoin will further decline to lower levels after the end of the correction [2].
InstaForex analytical reviews will make you fully aware of market trends! Being an InstaForex client, you are provided with a large number of free services for efficient trading.
Your IP address shows that you are currently located in the USA. If you are a resident of the United States, you are prohibited from using the services of Instant Trading EU Ltd including online trading, online transfers, deposit/withdrawal of funds, etc.
If you think you are seeing this message by mistake and your location is not the US, kindly proceed to the website. Otherwise, you must leave the website in order to comply with government restrictions.
Why does your IP address show your location as the USA?
Please confirm whether you are a US resident or not by clicking the relevant button below. If you choose the wrong option, being a US resident, you will not be able to open an account with InstaForex anyway.
We are sorry for any inconvenience caused by this message.


