 Stay
Stay 
Trading Conditions
Products
Tools


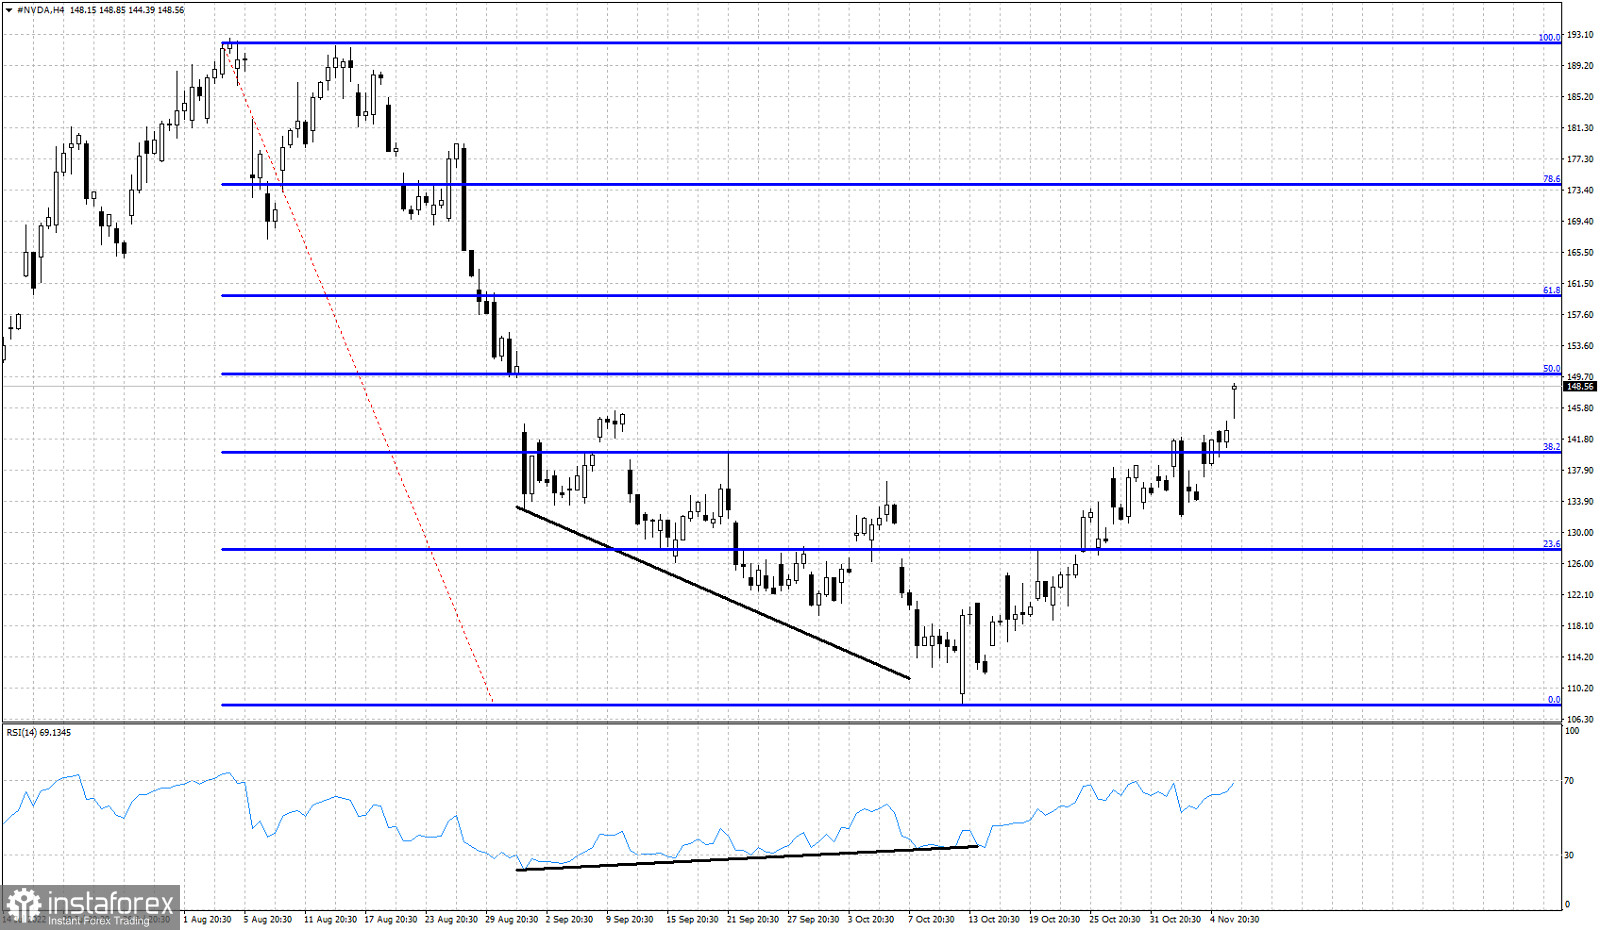
Blue lines- Fibonacci retracements
Black lines- RSI bullish divergence
On October 10th we posted our analysis on NVDA stock when price was trading around $120. We then noted that although trend remained bearish, there were increased chances of a bounce higher. The following days after we posted our analysis, NVDA stock price made a new lower low around $108.15 and started an upward bounce. So far price has retraced nearly 50% of the decline from $192.68. Price has started making higher highs and higher lows. The momentum in the near term is bullish. Next resistance level is at $150 and next at $159.90. Support is found at $131.80.
InstaForex analytical reviews will make you fully aware of market trends! Being an InstaForex client, you are provided with a large number of free services for efficient trading.
Your IP address shows that you are currently located in the USA. If you are a resident of the United States, you are prohibited from using the services of Instant Trading EU Ltd including online trading, online transfers, deposit/withdrawal of funds, etc.
If you think you are seeing this message by mistake and your location is not the US, kindly proceed to the website. Otherwise, you must leave the website in order to comply with government restrictions.
Why does your IP address show your location as the USA?
Please confirm whether you are a US resident or not by clicking the relevant button below. If you choose the wrong option, being a US resident, you will not be able to open an account with InstaForex anyway.
We are sorry for any inconvenience caused by this message.


