Trading Conditions
Products
Tools
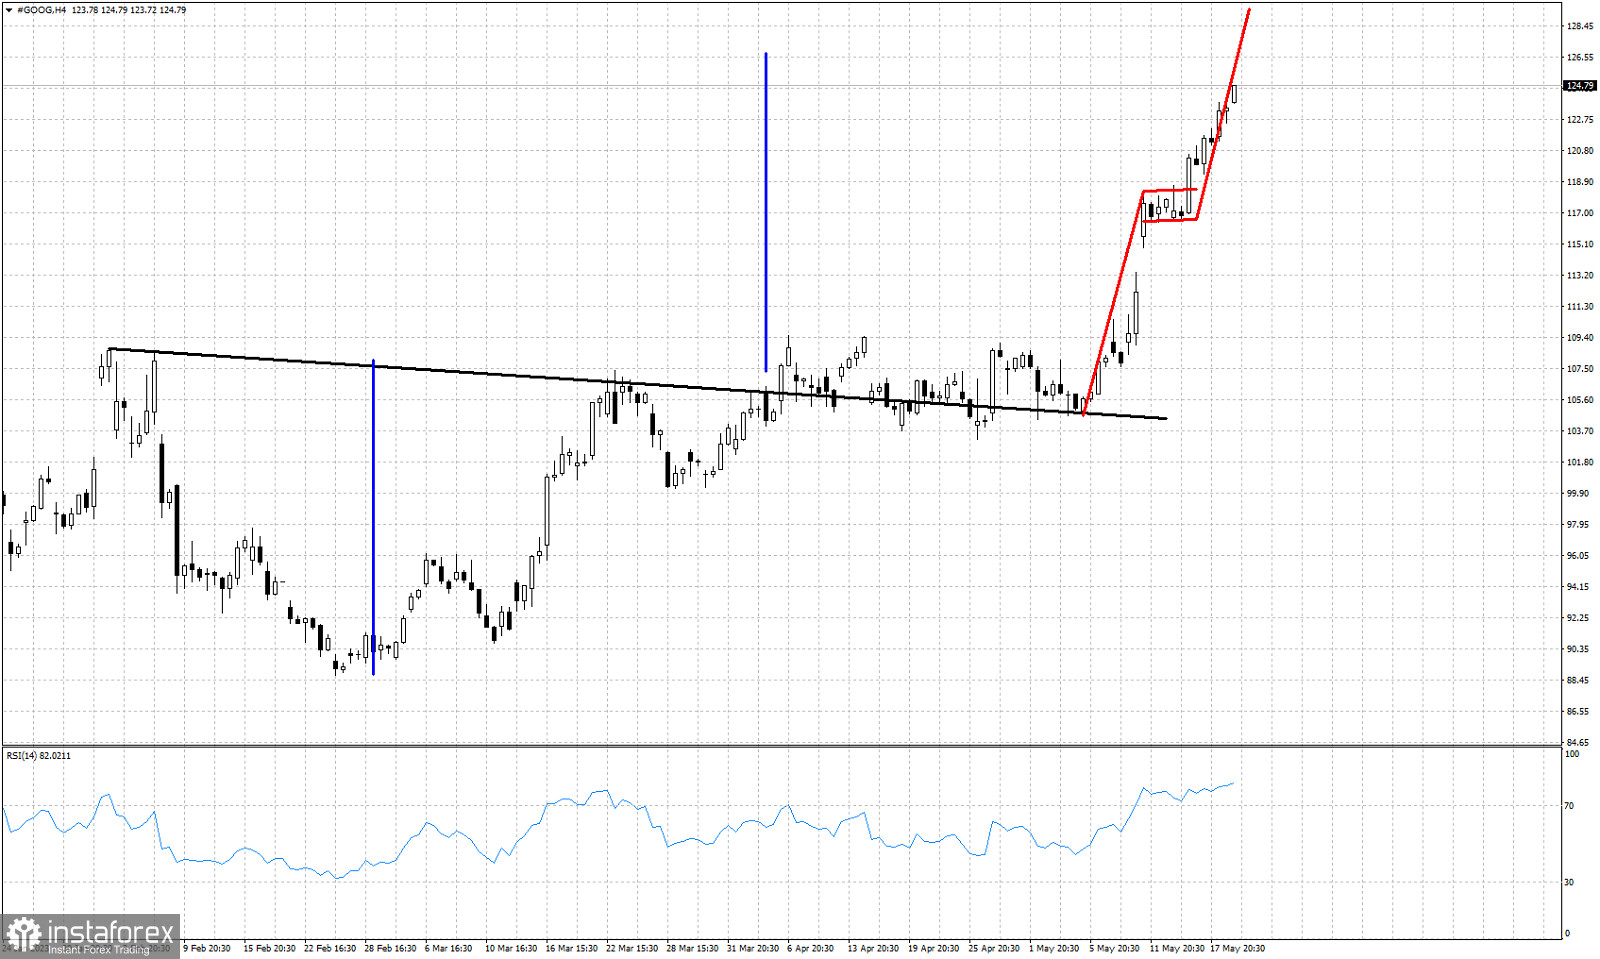
Black line -resistance
Blue lines- expected rise equal to height of cup
Red lines- bullish flag
In our previous analysis on GOOG stock price we talked about the short-term bullish flag formation price was exhibiting. Since then price has broken the bullish flag pattern upwards and price continues making higher highs. Short-term trend is clearly still bullish as price is approaching both the cup and handle and the bullish flag targets. Previous resistance is now support, so bulls do not want to see price break below $117. Upside expected target area remains at $127-$130 zone.
InstaForex analytical reviews will make you fully aware of market trends! Being an InstaForex client, you are provided with a large number of free services for efficient trading.
We may place cookies for analysis of our visitor data, to improve our website and measure advertising performance. Overall this data is used to provide a better website experience. More information
Your IP address shows that you are currently located in the USA. If you are a resident of the United States, you are prohibited from using the services of Instant Trading EU Ltd including online trading, online transfers, deposit/withdrawal of funds, etc.
If you think you are seeing this message by mistake and your location is not the US, kindly proceed to the website. Otherwise, you must leave the website in order to comply with government restrictions.
Why does your IP address show your location as the USA?
Please confirm whether you are a US resident or not by clicking the relevant button below. If you choose the wrong option, being a US resident, you will not be able to open an account with InstaForex anyway.
We are sorry for any inconvenience caused by this message.