empty
 
 
You are about to leave
www.instaforex.eu >
a website operated by
INSTANT TRADING EU LTD
Open Account

30.06.202317:22 Forex Analysis & Reviews: Inverted head and Shoulders pattern in BIDU stock.

Long-term review
This information is provided to retail and professional clients as part of marketing communication. It does not contain and should not be construed as containing investment advice or investment recommendation or an offer or solicitation to engage in any transaction or strategy in financial instruments. Past performance is not a guarantee or prediction of future performance. Instant Trading EU Ltd. makes no representation and assumes no liability as to the accuracy or completeness of the information provided, or any loss arising from any investment based on analysis, forecast or other information provided by an employee of the Company or otherwise. Full disclaimer is available here.

Exchange Rates 30.06.2023 analysis

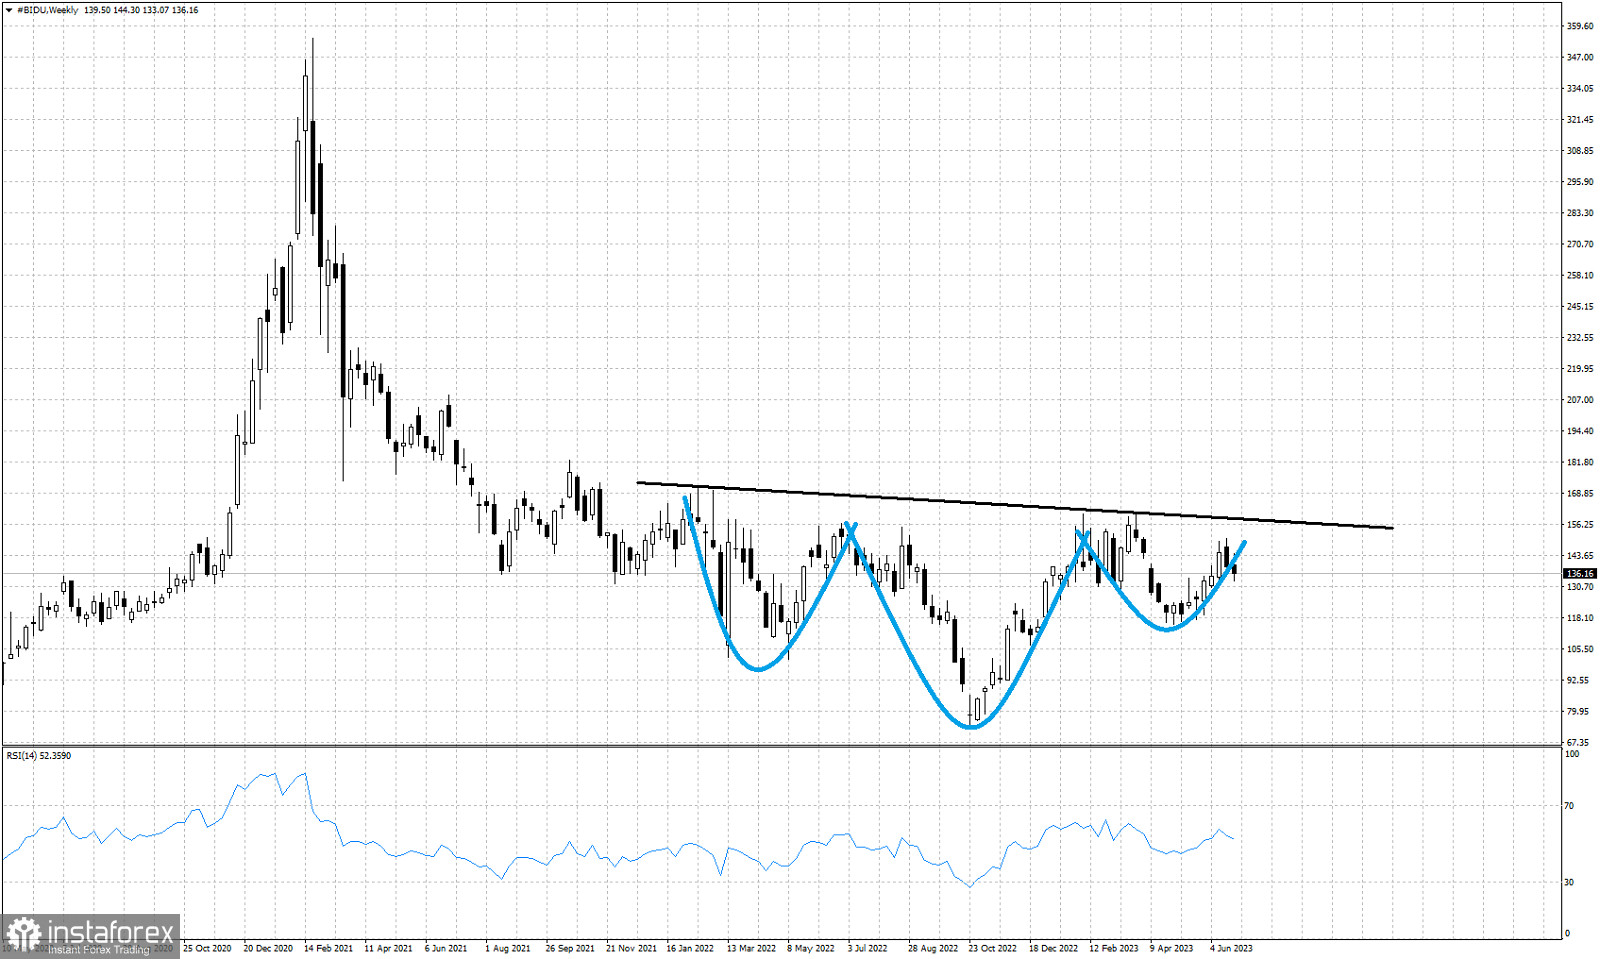
Black line- neckline resistance

Blue lines- Head and Shoulders pattern

The Bidu stock price is trading around $136. Price has mostly been moving sideways over the last 2 years. Today we focus on the inverted head and shoulders pattern it has formed in the weekly chart. The neckline resistance is found at $158-$159 and a weekly close above this level will activate this bullish pattern. If the pattern is activated then we will have $240-$250 as a target. Support is at the right hand shoulder low of $115. A break below this level cancels this scenario.

Alexandros Yfantis
Analytical expert of InstaForex
© 2007-2025

Open trading account

InstaForex analytical reviews will make you fully aware of market trends! Being an InstaForex client, you are provided with a large number of free services for efficient trading.


You are now leaving www.instaforex.eu, a website operated by INSTANT TRADING EU LTD
Can't speak right now?
Ask your question in the chat.
Widget callback

Turn "Do Not Track" off