 Stay
Stay 
Trading Conditions
Products
Tools


Bitcoin continues its consolidation price movement below the $17k level, where the asset's key support zone lies. The active redistribution of free BTC volumes and the increase in correlation with stock indices also continue.
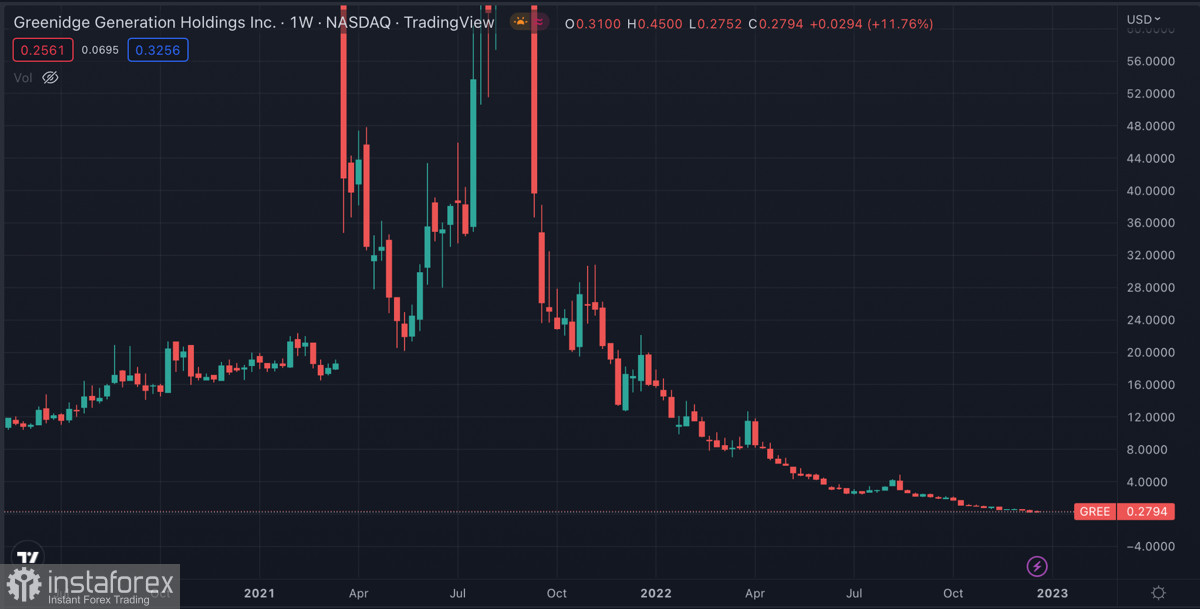
We have already talked about the bankruptcy of one of the largest U.S. mining firms, Core Scientific. Another industry giant, Greenidge Generation, reached a consensus with a creditor, NYDIG, on a $76 million debt restructuring.
Gradually, more and more news about the deplorable state of the mining industry appears in the information space, which negatively affects the prospects for the upward movement of Bitcoin.
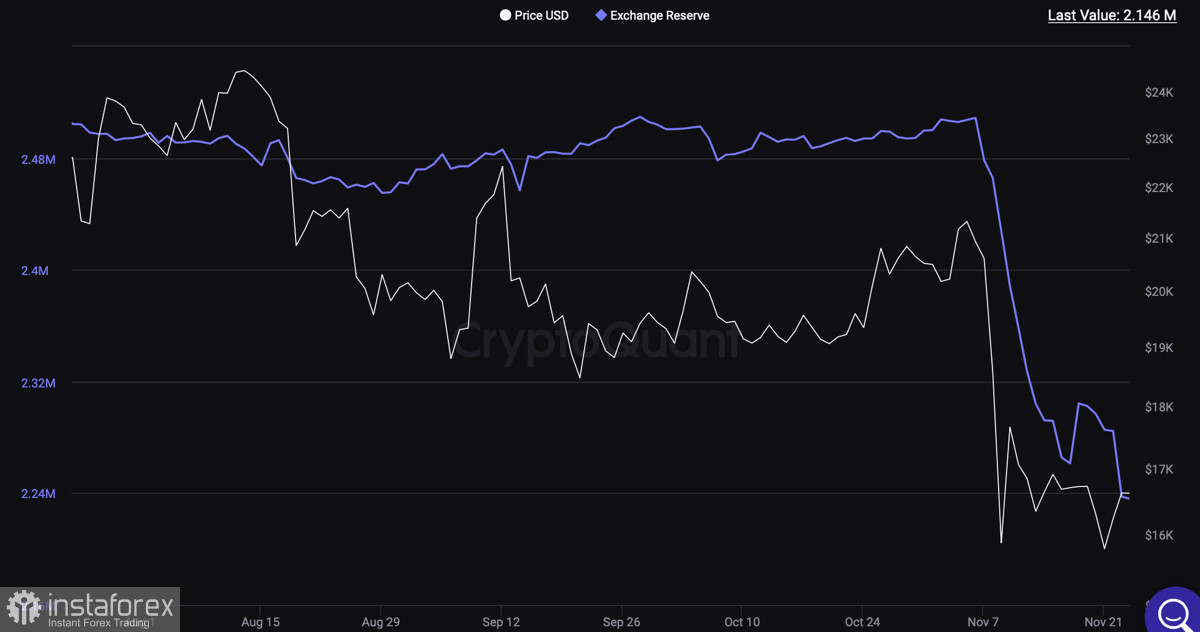
Despite this, all sold volumes of BTC are gradually passing into the hands of long-term investors, which brings the bullish trend closer. As of December 22, the volume of BTC coins on exchanges fell to 2.2 million and updated a 5-year low.
At the same time, Kaiko analysts note a significant decrease in open interest in Bitcoin. On the one hand, this suggests that the rate of accumulation is falling due to fundamentally weak investor interest. On the other hand, this may indicate that the final phase of accumulation is approaching.
The correlation between cryptocurrencies and stock indices continues to strengthen. In the future, this will bring both positive and negative consequences for Bitcoin and other digital assets. However, in the near term, this may positively affect cryptocurrency quotes.
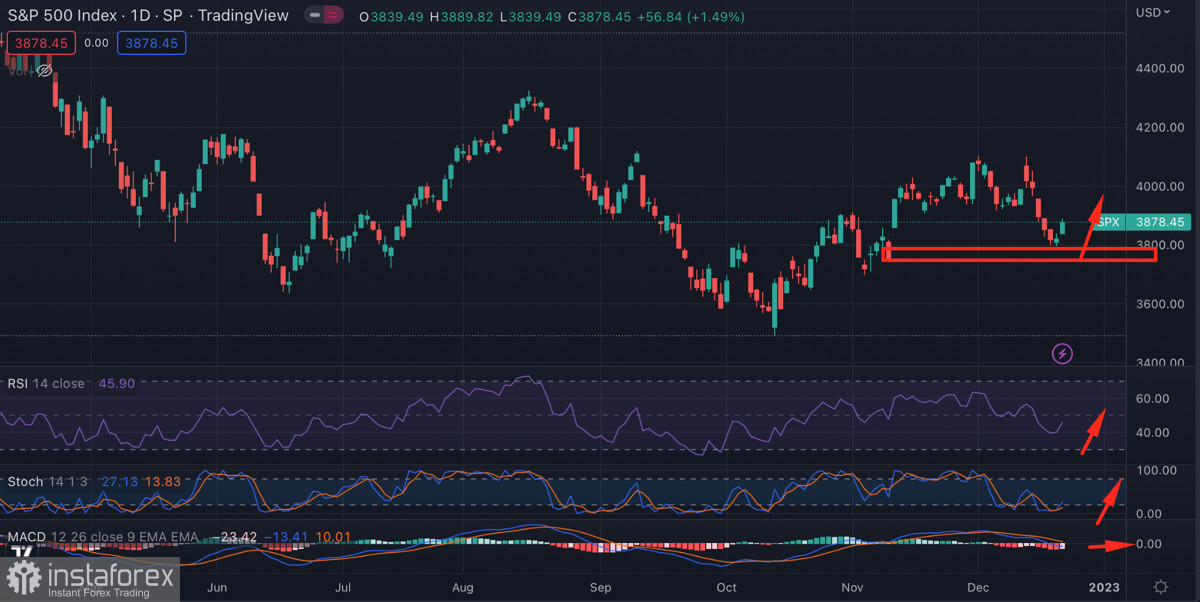
The SPX index shows local signals for a recovery movement due to the activation of buyers. The main technical metrics of the financial instrument show growing buying activity and protection of the $3,800 key support zone.
Given the correlation between BTC and SPX, it is likely that the cryptocurrency will follow the lead of the stock index. However, as of writing, Bitcoin does not signal a potential upward movement.
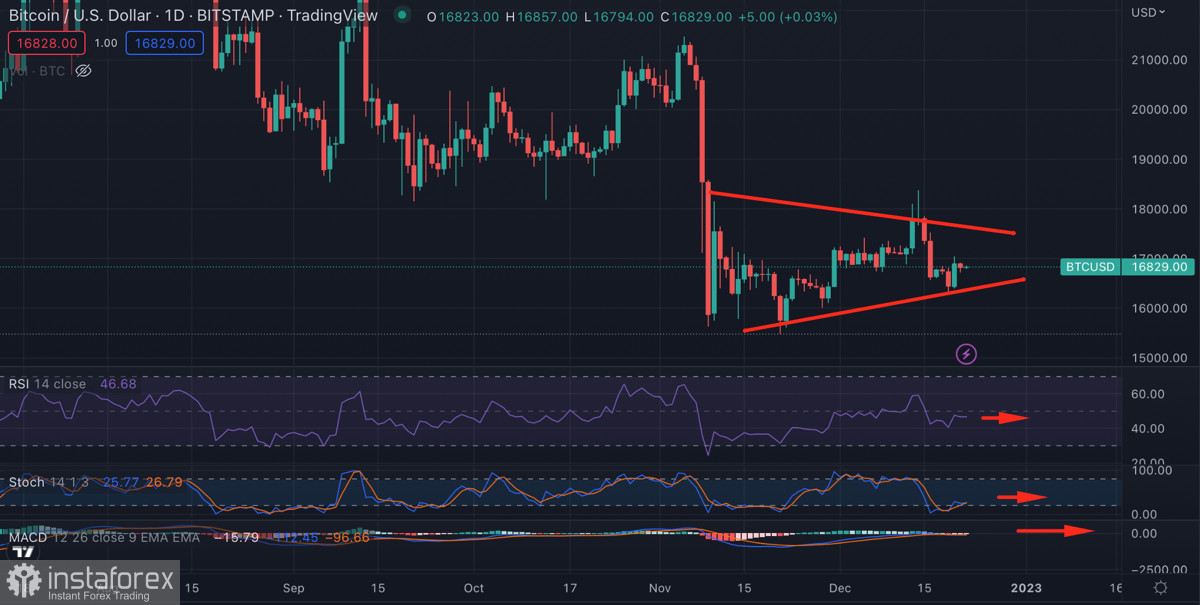
The main technical metrics of the cryptocurrency on the daily chart indicate a continuation of the consolidation movement. The RSI index and the stochastic oscillator continue to move flat without a hint of bullish formations.
On the four-hour chart, the situation looks even sadder due to the activation of sellers. The stochastic oscillator has formed a bearish crossover and is moving towards the oversold zone. The RSI index is moving flat, but given the nature of the movement of other indicators, it will also begin to decline.
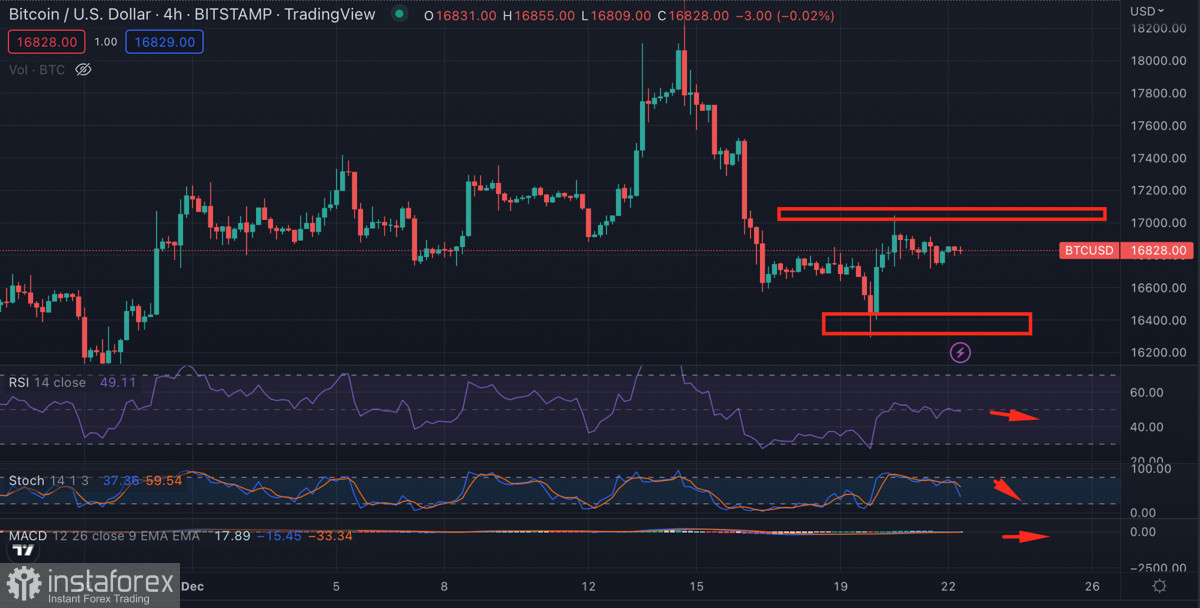
As of writing, Bitcoin is acquiring an intraday downward trend with a main target of $16k–$16.4k. At the same time, sales volumes are not enough for a long-term pressure on the price, and later, the bulls can restore parity due to the opening of U.S. markets.
Bitcoin is moving towards a retest of the $16k–$16.4k support area, however the current bearish volumes do not give any reason to believe that the target will be reached. As signals for a further decline, the price of BTC should break through the levels of $16.8k and $16,650.
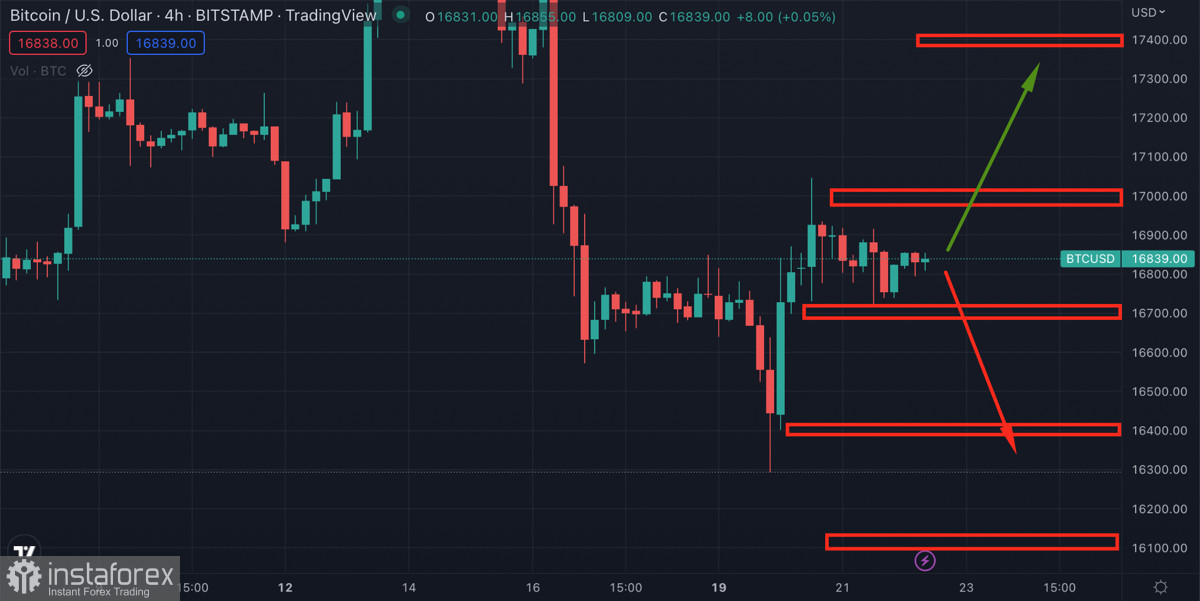
However, don't forget the correlation factor with stock indices, which can contribute to the reversal of the asset's price. Although, for buyers, the task looks even more unrealistic—to gain a foothold above $17k. In this case, the bearish idea with a $16k–$16.4k retest disappears, and an upward spurt to $17.4k takes place.
InstaForex analytical reviews will make you fully aware of market trends! Being an InstaForex client, you are provided with a large number of free services for efficient trading.
Your IP address shows that you are currently located in the USA. If you are a resident of the United States, you are prohibited from using the services of Instant Trading EU Ltd including online trading, online transfers, deposit/withdrawal of funds, etc.
If you think you are seeing this message by mistake and your location is not the US, kindly proceed to the website. Otherwise, you must leave the website in order to comply with government restrictions.
Why does your IP address show your location as the USA?
Please confirm whether you are a US resident or not by clicking the relevant button below. If you choose the wrong option, being a US resident, you will not be able to open an account with InstaForex anyway.
We are sorry for any inconvenience caused by this message.


