empty
 
 
You are about to leave
www.instaforex.eu >
a website operated by
INSTANT TRADING EU LTD
Open Account

07.08.202319:38 Forex Analysis & Reviews: Technical analysis on BIDU stock price for week starting August 7th, 2023.

Long-term review
This information is provided to retail and professional clients as part of marketing communication. It does not contain and should not be construed as containing investment advice or investment recommendation or an offer or solicitation to engage in any transaction or strategy in financial instruments. Past performance is not a guarantee or prediction of future performance. Instant Trading EU Ltd. makes no representation and assumes no liability as to the accuracy or completeness of the information provided, or any loss arising from any investment based on analysis, forecast or other information provided by an employee of the Company or otherwise. Full disclaimer is available here.

Exchange Rates 07.08.2023 analysis

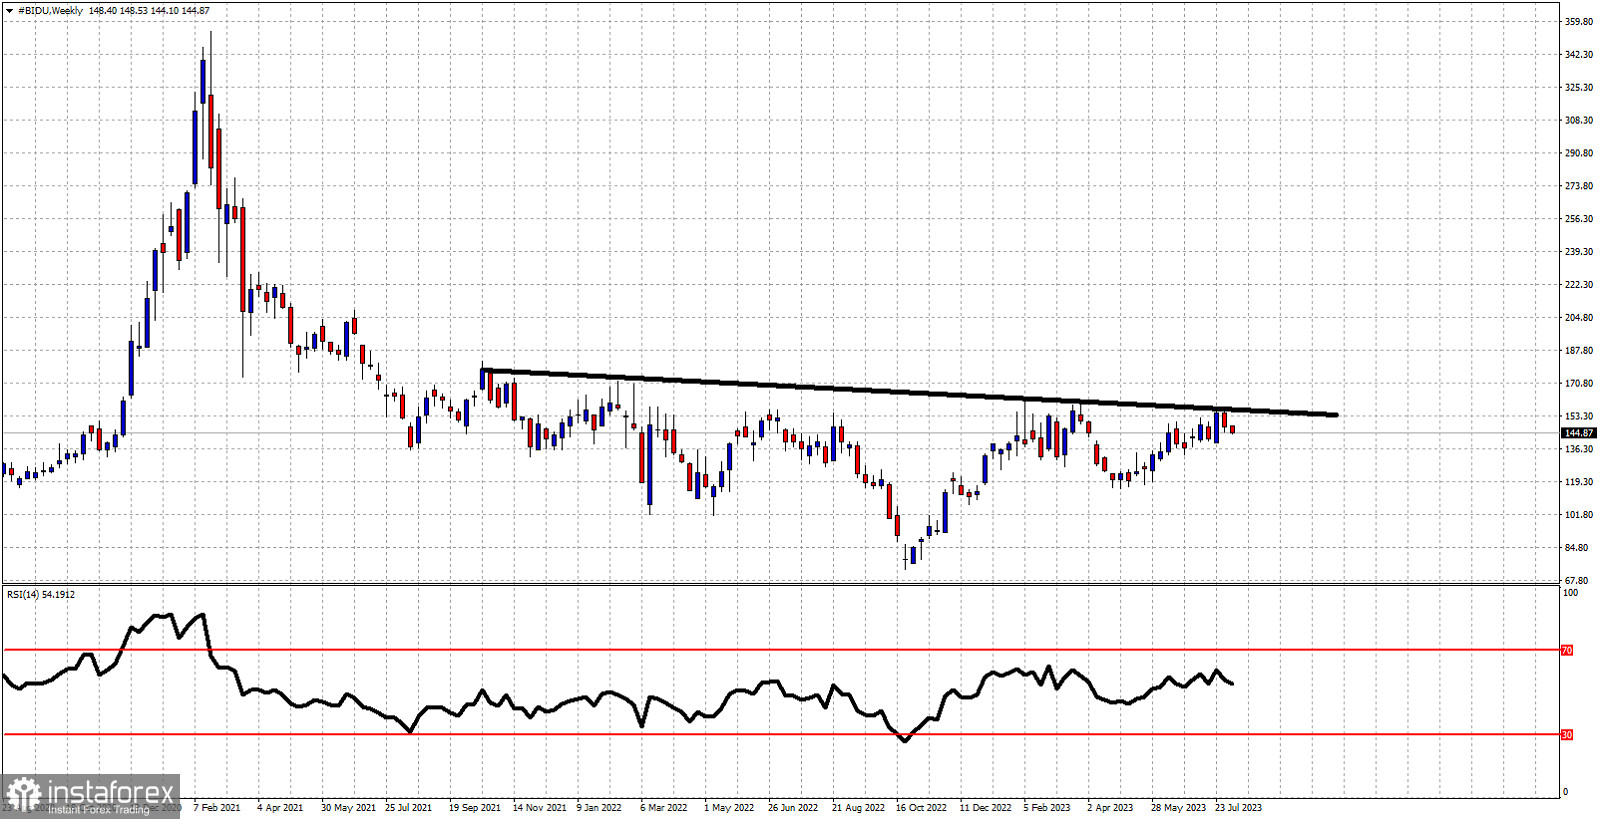
Black line - neckline resistance trend line

BIDU stock price has started trading this week under pressure around $144-$145 after last week's rejection at $156.75. As we mentioned in previous posts, BIDU stock price has formed an inverted head and shoulders pattern with excellent upside potential, IF price breaks above the black resistance trend line. The black neckline resistance has been confirmed several times over the last two years. A weekly close above $157 would provide a bullish signal that will give us $245 as target.

Alexandros Yfantis
Analytical expert of InstaForex
© 2007-2025

Open trading account

InstaForex analytical reviews will make you fully aware of market trends! Being an InstaForex client, you are provided with a large number of free services for efficient trading.


You are now leaving www.instaforex.eu, a website operated by INSTANT TRADING EU LTD
Can't speak right now?
Ask your question in the chat.
Widget callback

Turn "Do Not Track" off