 Stay
Stay 
Trading Conditions
Products
Tools

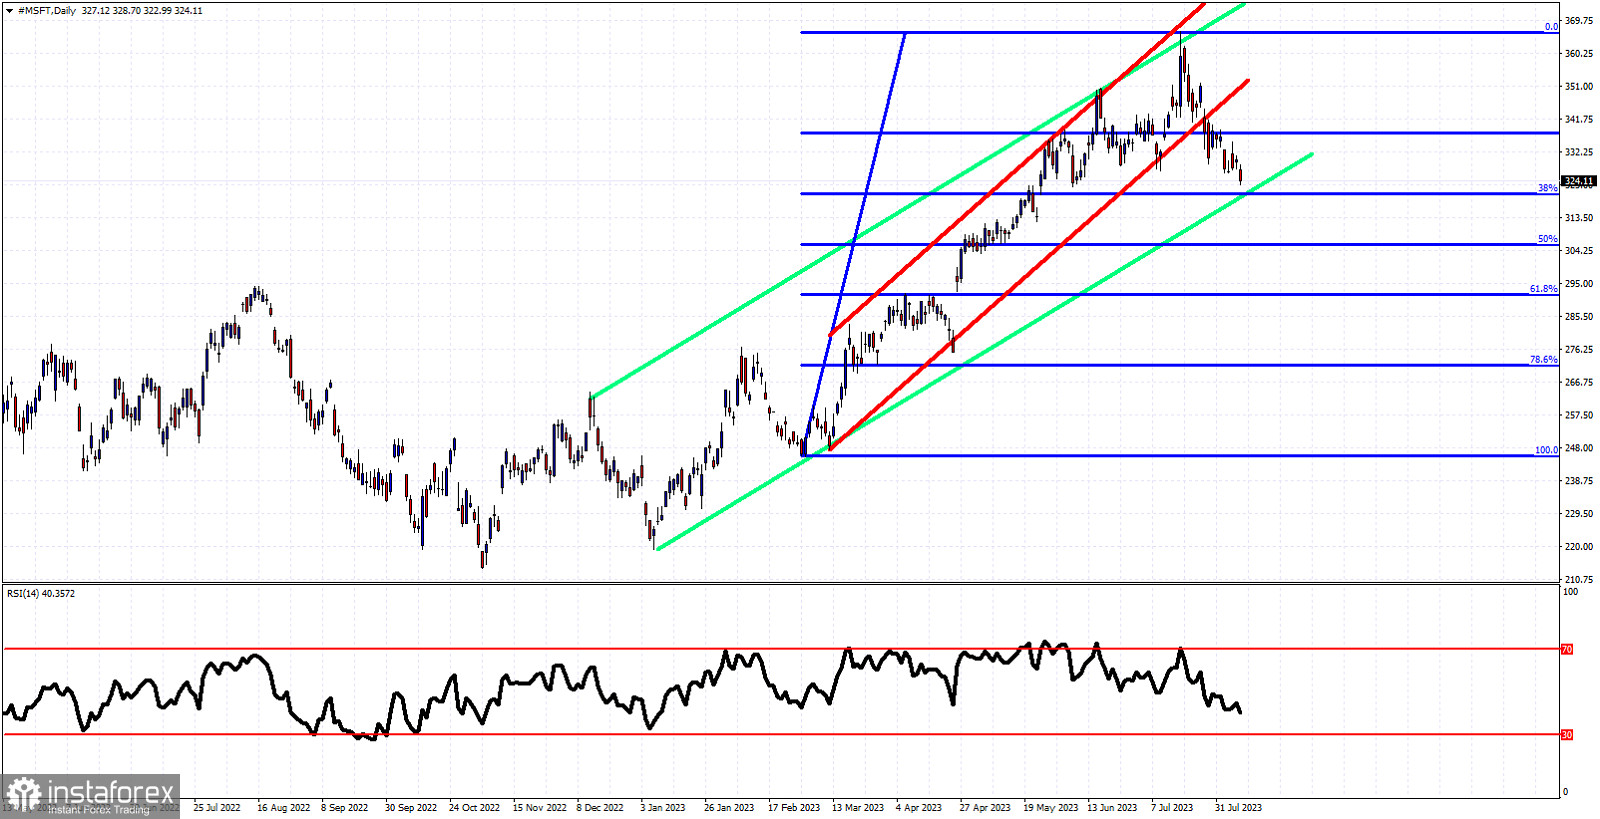
Red lines- bullish channel (broken)
Green lines- bullish channel
Blue lines- Fibonacci retracement levels
MSFT stock price is in a short-term bearish trend. After the major high around $366, MSFT stock price started a short-term bearish trend that pushed price out and below the red channel. The move from the $247 low is most probably over and price is now making a correction for this upward wave. MSFT stock price is approaching important Fibonacci support. The 38% Fibonacci retracement is found at $320 where we also find the lower channel boundary of the bigger green channel. This is important support that bulls do not want to see broken. MSFT is approaching important support area and possible reversal area.
InstaForex analytical reviews will make you fully aware of market trends! Being an InstaForex client, you are provided with a large number of free services for efficient trading.
We may place cookies for analysis of our visitor data, to improve our website and measure advertising performance. Overall this data is used to provide a better website experience. More information
Your IP address shows that you are currently located in the USA. If you are a resident of the United States, you are prohibited from using the services of Instant Trading EU Ltd including online trading, online transfers, deposit/withdrawal of funds, etc.
If you think you are seeing this message by mistake and your location is not the US, kindly proceed to the website. Otherwise, you must leave the website in order to comply with government restrictions.
Why does your IP address show your location as the USA?
Please confirm whether you are a US resident or not by clicking the relevant button below. If you choose the wrong option, being a US resident, you will not be able to open an account with InstaForex anyway.
We are sorry for any inconvenience caused by this message.


