 Stay
Stay 
Trading Conditions
Products
Tools


The economic calendar is traditionally empty on Monday. No important reports were published in the European Union, the United Kingdom, and the Unites States.
Investors and traders were focused on the news flow when an important topic emerged—the banking crisis in the United States. High-ranking officials, including U.S. President Joe Biden and Federal Reserve Chairman Jerome Powell, addressed the issue.
In his speech, the President of the United States put forward the following theses:
• Silicon Valley Bank and Signature Bank assets are under the control of the FDIC.
• U.S. taxpayers will not suffer any losses as the FDIC will cover all costs.
• The administration's swift action should reassure Americans that the U.S. banking system is safe.
• Managers of failing banks should be removed from their positions.
• [Biden] intend to ask Congress and regulators to increase their control over the banking sector.
• The administration will do its best to avoid similar situation in the future.
It is worth noting that an emergency meeting of the Federal Reserve System (Fed) was held yesterday, but the details of its discussion remained behind closed doors. Nevertheless, the media began to actively discuss a possible revision of the Fed's plans for further interest rate hikes, possibly before a temporary stop as part of the increase cycle.
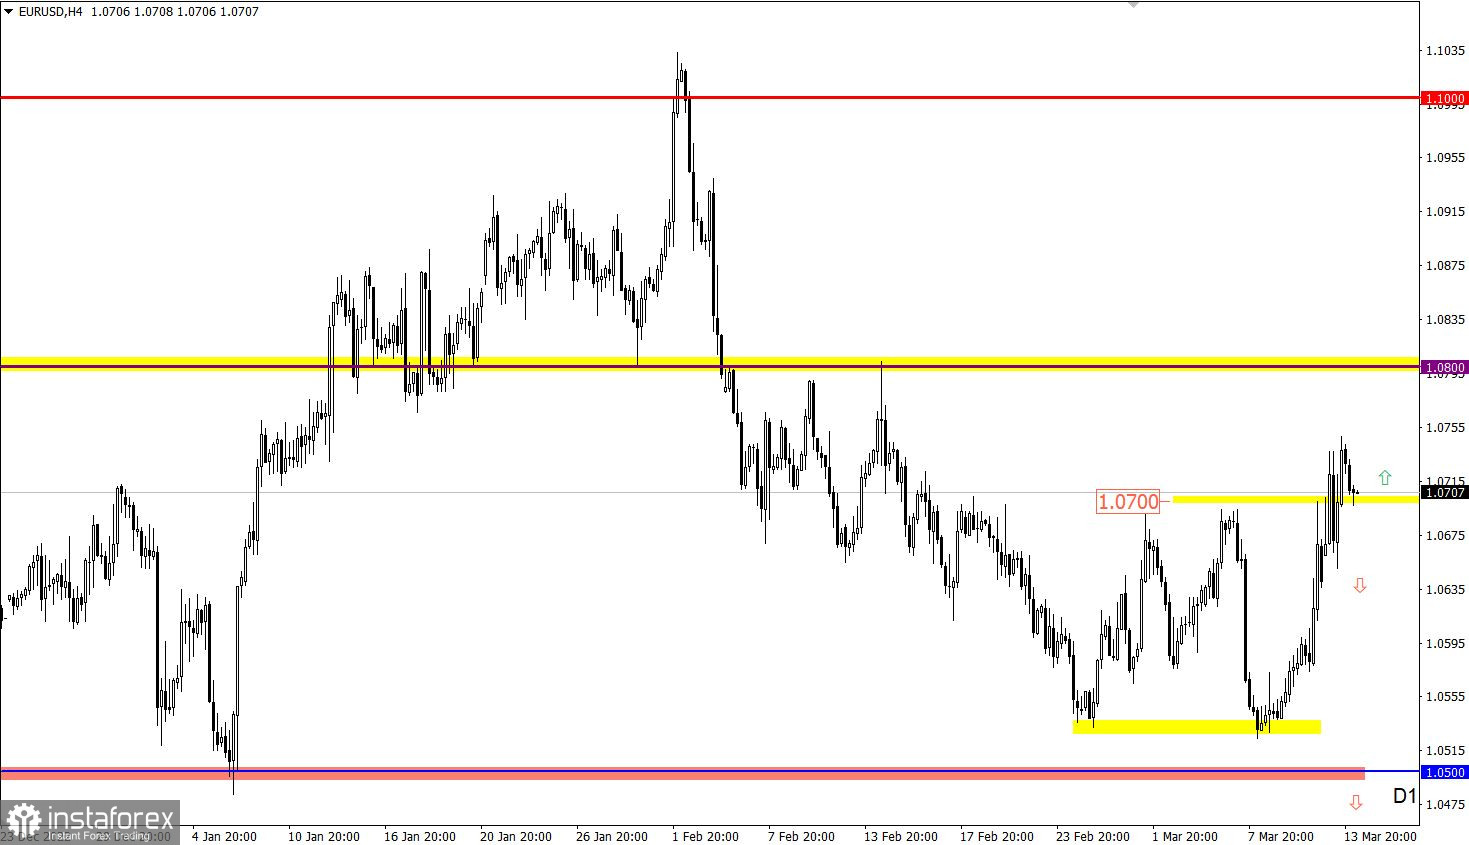
EURUSD held above the 1.0700 level for the second trading day in a row. This indicates an increase in the volume of long positions and is a positive technical signal.
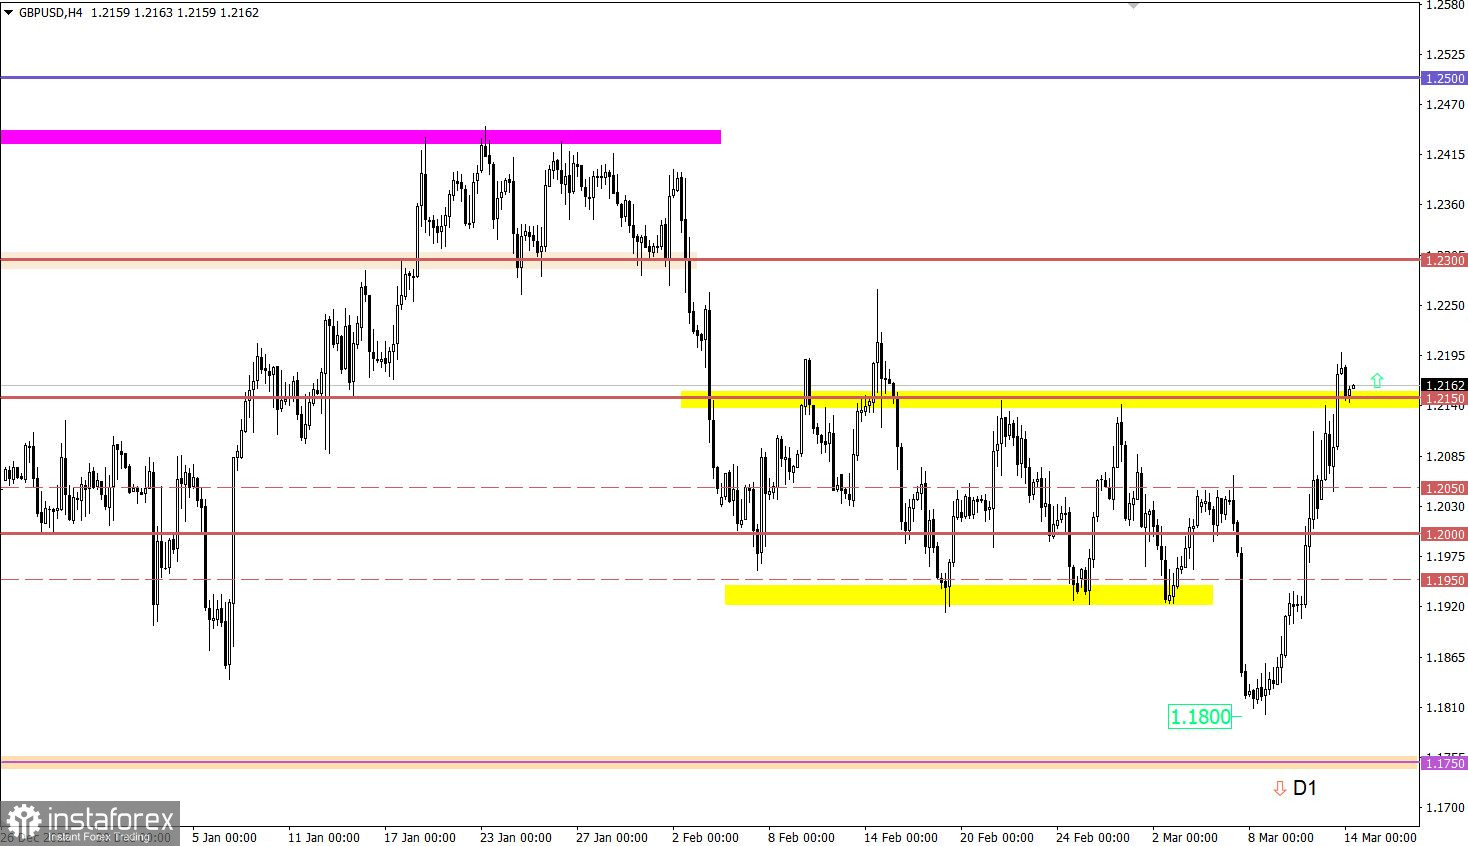
GBPUSD was above the 1.2150 resistance level for the first time since mid-February, indicating the interest of traders in the upward cycle and accompanied by an increase in the volume of long positions.

At the opening of the European session, data on the UK labor market was released. Unemployment again remained at 3.7%, against the 3.8% estimate. However, employment in the country increased by 65,000, and the number of applications for unemployment benefits decreased by 11,200. If we disregard some discrepancies in economic forecasts, then the data on the UK labor market came out quite well.
The main topic of the day is the publication of inflation data in the United States. Economists forecast that its level may fall from 6.4% to 6.0%. This is a positive factor for accumulating data for subsequent decision-making on interest rates in terms of revising the current monetary policy.
A decline in inflation could lead to a further weakening of the dollar position.
Traders are considering a possible scenario of a gradual recovery of the euro after the decline in February. For this scenario to be confirmed, the quote needs to overcome the 1.0800 resistance level. However, in case the price returns below the 1.0650 support level, traders will reconsider the downside scenario.
In the future, holding the price above 1.2150 may indicate a gradual recovery in the value of the pound sterling after the fall in February. If the price drops below 1.2100, traders will consider an alternative scenario.
The candlestick chart type is white and black graphic rectangles with lines above and below. With a detailed analysis of each individual candle, you can see its characteristics relative to a particular time frame: opening price, closing price, intraday high and low.
Horizontal levels are price coordinates, relative to which a price may stop or reverse its trajectory. In the market, these levels are called support and resistance.
Circles and rectangles are highlighted examples where the price reversed in history. This color highlighting indicates horizontal lines that may put pressure on the asset's price in the future.
The up/down arrows are landmarks of the possible price direction in the future.
InstaForex analytical reviews will make you fully aware of market trends! Being an InstaForex client, you are provided with a large number of free services for efficient trading.

