 Stay
Stay 
Trading Conditions
Products
Tools


UK labor market data was mixed. Despite forecasts of growth to 3.8%, unemployment remained at 3.7%. However, employment in the country increased by 65,000, and unemployment claims fell by 11,200. If we ignore some discrepancies in economic forecasts, we can say that the UK labor market data looks quite favorable.
The main event of the day was the U.S. inflation data which slowed to its lowest level since September 2021. The U.S. consumer price index (CPI) fell to 6% in February from 6.4% in January, in line with analysts' forecasts. Monthly rates, however, do not yet show a significant decline. The financial markets' reaction to this data manifested itself in increased volatility. At the time, the U.S. stock indices began to rise, but the dollar positions on the FOREX market continued to decline.
EUR/USD continued to rise after a short pullback. The previously passed level of 1.0700 played the role of support, strengthening long positions on the market.
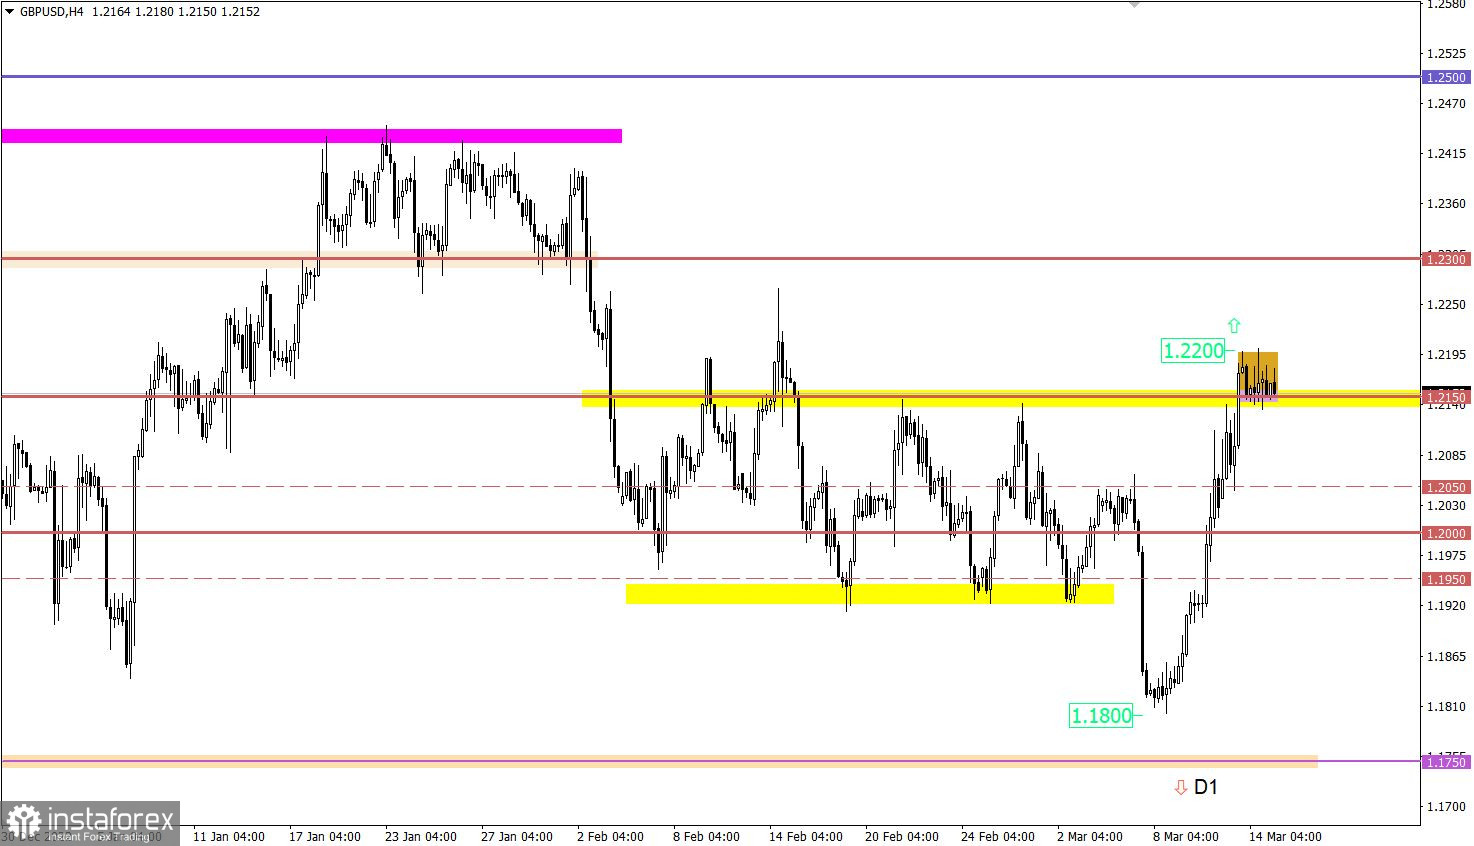
GBP/USD formed a stagnation slightly above the previously passed level of 1.2150. This stop in the form of consolidation may well indicate the process of regrouping trading forces before a new price spike.

Today we are waiting for the publication of several statistical reports. First will be the volume of industrial production in the European Union. Economists estimate a 0.4% MoM growth, which is positive .
During the U.S. trading session, there will be data on U.S. retail sales, where a decline is expected, as well as the producer price index, which is estimated to decline from 6.0% to 5.4%. Both can be categorized as negative.
Time targeting:
EU Industrial Production – 10:00 UTC
U.S. Retail Sales – 12:30 UTC
U.S. Producer Price Index – 12:30 UTC
A technical signal of change in trading interests will arise when the euro holds above 1.0800, indicating a gradual recovery of the exchange rate after the decline in February. Traders consider this level as resistance, and before its breakout, a reduction in the volume of long positions in the euro is possible.

Presumably, the level of 1.2150 can act as support for further growth in the volume of long positions, but for the sustained development of the upward trend, it is necessary to keep the price above 1.2200. In this case the extension of the upward cycle to the level of 1.2300 and higher is possible.
At the same time, the return of the price below 1.2100 may be a signal for the market participants to consider an alternative scenario.
The candlestick chart type is white and black graphic rectangles with lines above and below. With a detailed analysis of each individual candle, you can see its characteristics relative to a particular time frame: opening price, closing price, intraday high and low.
Horizontal levels are price coordinates, relative to which a price may stop or reverse its trajectory. In the market, these levels are called support and resistance.
Circles and rectangles are highlighted examples where the price reversed in history. This color highlighting indicates horizontal lines that may put pressure on the asset's price in the future.
The up/down arrows are landmarks of the possible price direction in the future.
InstaForex analytical reviews will make you fully aware of market trends! Being an InstaForex client, you are provided with a large number of free services for efficient trading.

