Trading Conditions
Products
Tools
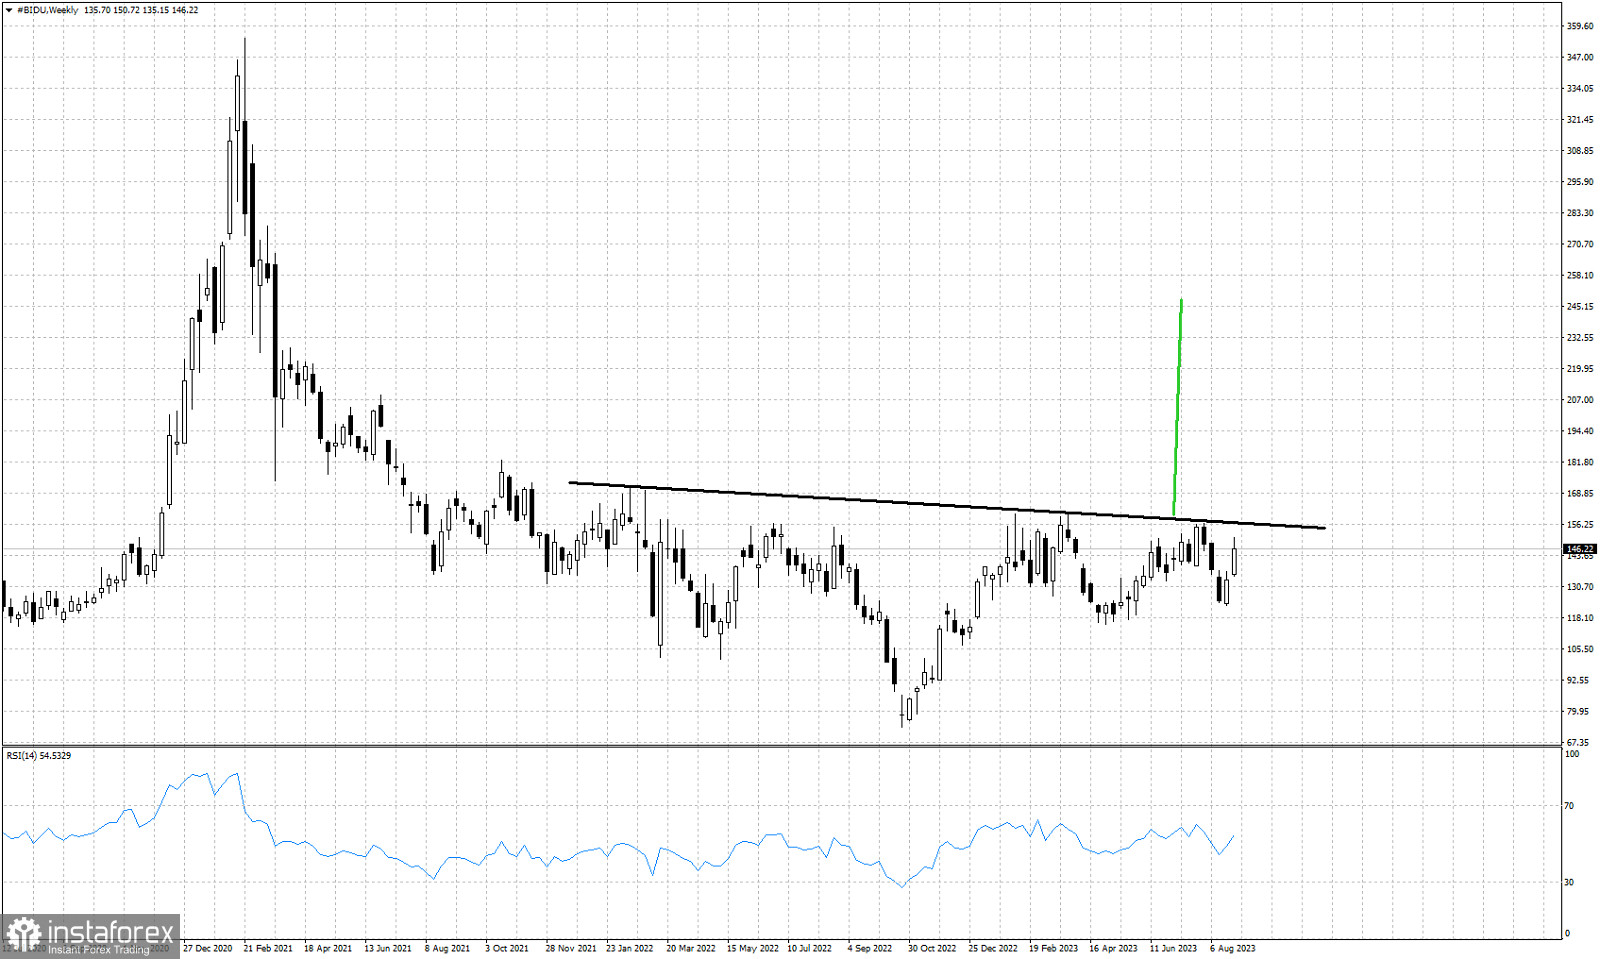
Black line -resistance neckline
green line- potential upside according to inverted head and shoulders pattern
In previous posts we talked about the potential inverted head and shoulders pattern in BIDU stock chart. In the weekly chart we clearly see another attempt by bulls to challenge the black horizontal resistance neckline. Key resistance remains at $156.50. A break above this neckline resistance will be a major bullish signal. Price action over the past 2 years has confirmed the importance of this resistance trend line. So a break above it will be big news for the stock price. An activation of the inverted head and shoulders pattern could mean price could move towards $250.
InstaForex analytical reviews will make you fully aware of market trends! Being an InstaForex client, you are provided with a large number of free services for efficient trading.
We may place cookies for analysis of our visitor data, to improve our website and measure advertising performance. Overall this data is used to provide a better website experience. More information
Your IP address shows that you are currently located in the USA. If you are a resident of the United States, you are prohibited from using the services of Instant Trading EU Ltd including online trading, online transfers, deposit/withdrawal of funds, etc.
If you think you are seeing this message by mistake and your location is not the US, kindly proceed to the website. Otherwise, you must leave the website in order to comply with government restrictions.
Why does your IP address show your location as the USA?
Please confirm whether you are a US resident or not by clicking the relevant button below. If you choose the wrong option, being a US resident, you will not be able to open an account with InstaForex anyway.
We are sorry for any inconvenience caused by this message.