 Stay
Stay 
Trading Conditions
Products
Tools


Trend analysis (fig. 1).
The pair may climb to 1.2199, the Fibonacci retracement level of 61.8% (blue dotted line) from 1.2108, the closing of yesterday's daily candlestick. After reaching this level, it is likely to retreat to 1.2140, the Fibonacci retracement level of 14.6% (yellow dotted line).
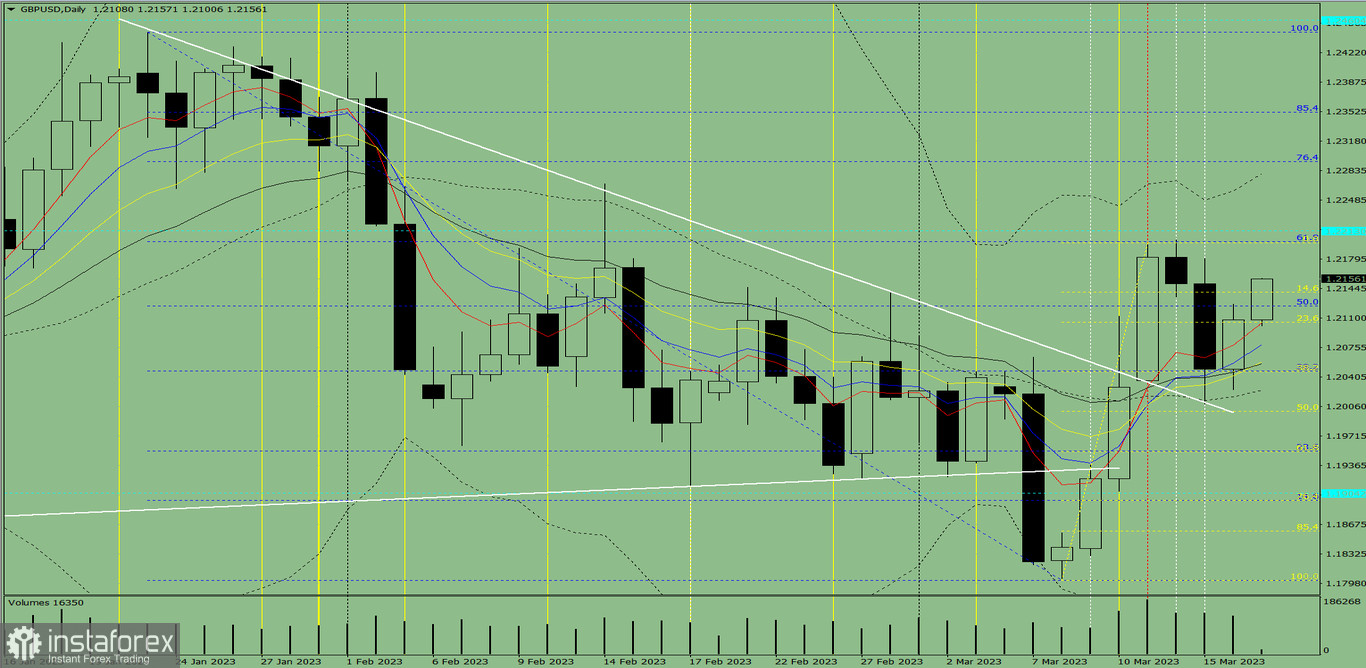
Fig. 1 (intraday chart).
Complex analysis:
- indicator analysis– up;
- Fibonacci levels – up;
- trading volumes – up;
- candlestick analysis – up;
- trend analysis – up;
- Bollinger lines – up;
- weekly chart - up.
Conclusion:
The pair may climb to 1.2199, the Fibonacci retracement level of 61.8% (blue dotted line) from 1.2108, the closing of yesterday's daily candlestick. After reaching this level, it is likely to retreat to 1.2140, the Fibonacci retracement level of 14.6% (yellow dotted line).
Alternatively, the price may move to 1.2199, the Fibonacci retracement level of 61.8% (blue dotted line) from 1.2108, the closing of yesterday's daily candlestick. After hitting this level, the price may rise higher.
InstaForex analytical reviews will make you fully aware of market trends! Being an InstaForex client, you are provided with a large number of free services for efficient trading.
Your IP address shows that you are currently located in the USA. If you are a resident of the United States, you are prohibited from using the services of Instant Trading EU Ltd including online trading, online transfers, deposit/withdrawal of funds, etc.
If you think you are seeing this message by mistake and your location is not the US, kindly proceed to the website. Otherwise, you must leave the website in order to comply with government restrictions.
Why does your IP address show your location as the USA?
Please confirm whether you are a US resident or not by clicking the relevant button below. If you choose the wrong option, being a US resident, you will not be able to open an account with InstaForex anyway.
We are sorry for any inconvenience caused by this message.


