 Stay
Stay 
Trading Conditions
Products
Tools


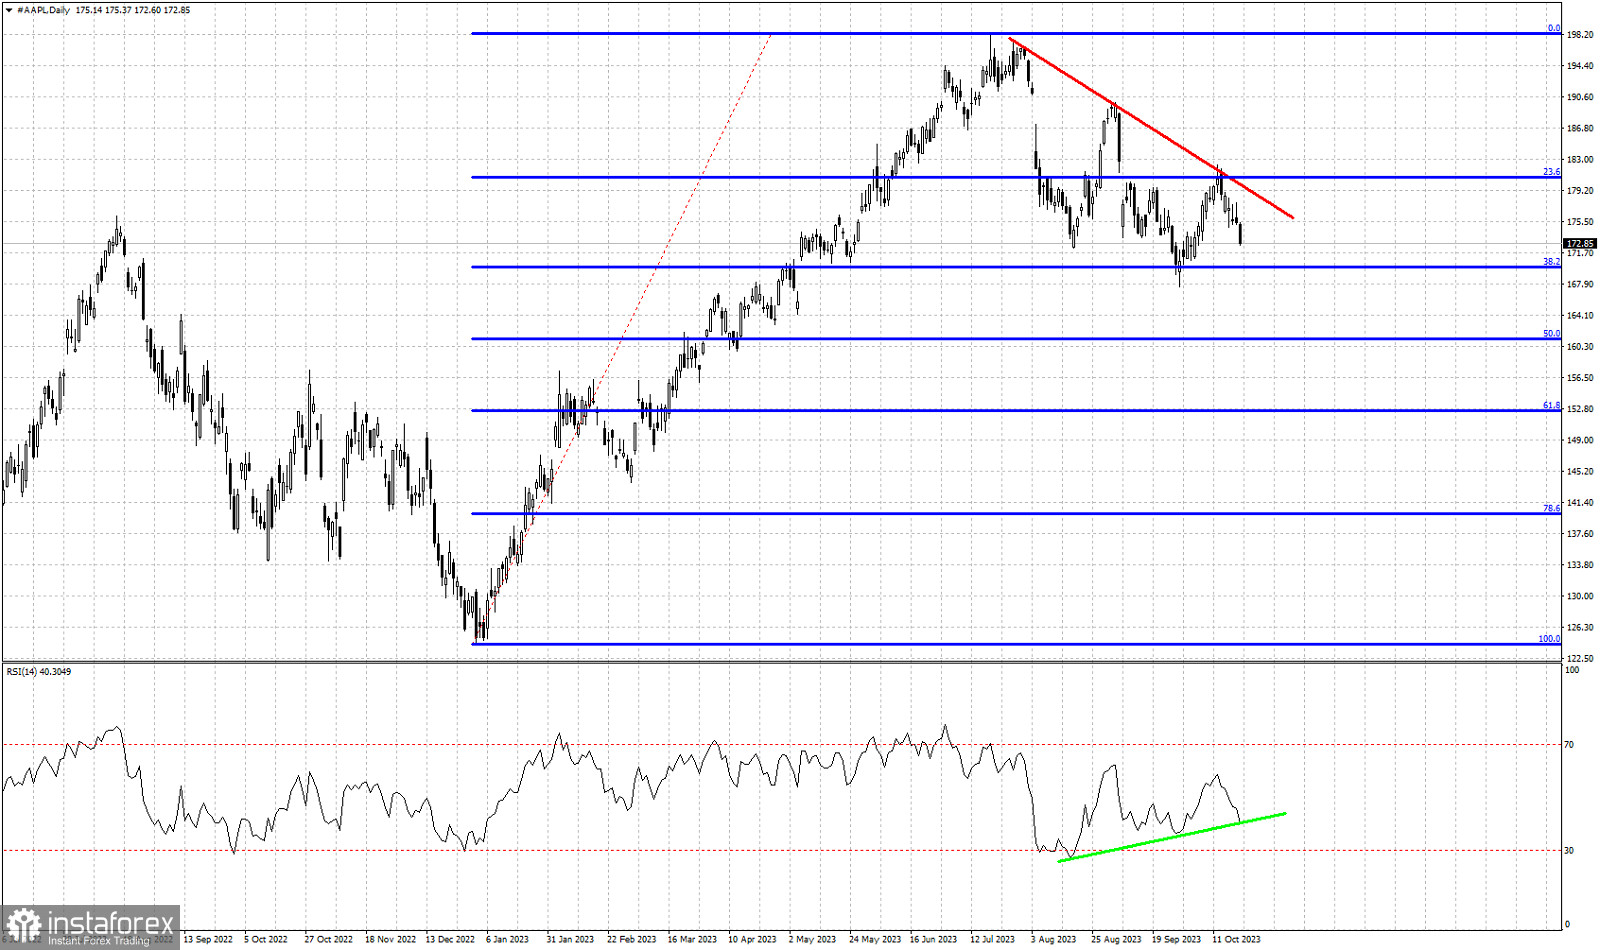
Red lines- bearish trend line
Blue lines- Fibonacci retracement levels
green line- RSI support trend line
AAPL stock price closed at its weekly low this past week. Price got rejected at the red resistance trend line at $182 resistance area and is now moving lower as expected by our previous analysis. Thus far price has formed two lower highs and two lower lows. Will we see a third lower low? Support is found at $170 where we see the 38% Fibonacci retracement where price bounced off last time. The RSI is challenging its own support trend line at recent close of $172.85. If selling pressures continue next week, we should expect $170 to be tested and maybe see new lower lows towards the 50% Fibonacci retracement at $161.30. Bears remain in control of the trend. So far we have no indication of a major low or trend reversal.
InstaForex analytical reviews will make you fully aware of market trends! Being an InstaForex client, you are provided with a large number of free services for efficient trading.
Your IP address shows that you are currently located in the USA. If you are a resident of the United States, you are prohibited from using the services of Instant Trading EU Ltd including online trading, online transfers, deposit/withdrawal of funds, etc.
If you think you are seeing this message by mistake and your location is not the US, kindly proceed to the website. Otherwise, you must leave the website in order to comply with government restrictions.
Why does your IP address show your location as the USA?
Please confirm whether you are a US resident or not by clicking the relevant button below. If you choose the wrong option, being a US resident, you will not be able to open an account with InstaForex anyway.
We are sorry for any inconvenience caused by this message.


