 Stay
Stay 
Trading Conditions
Products
Tools


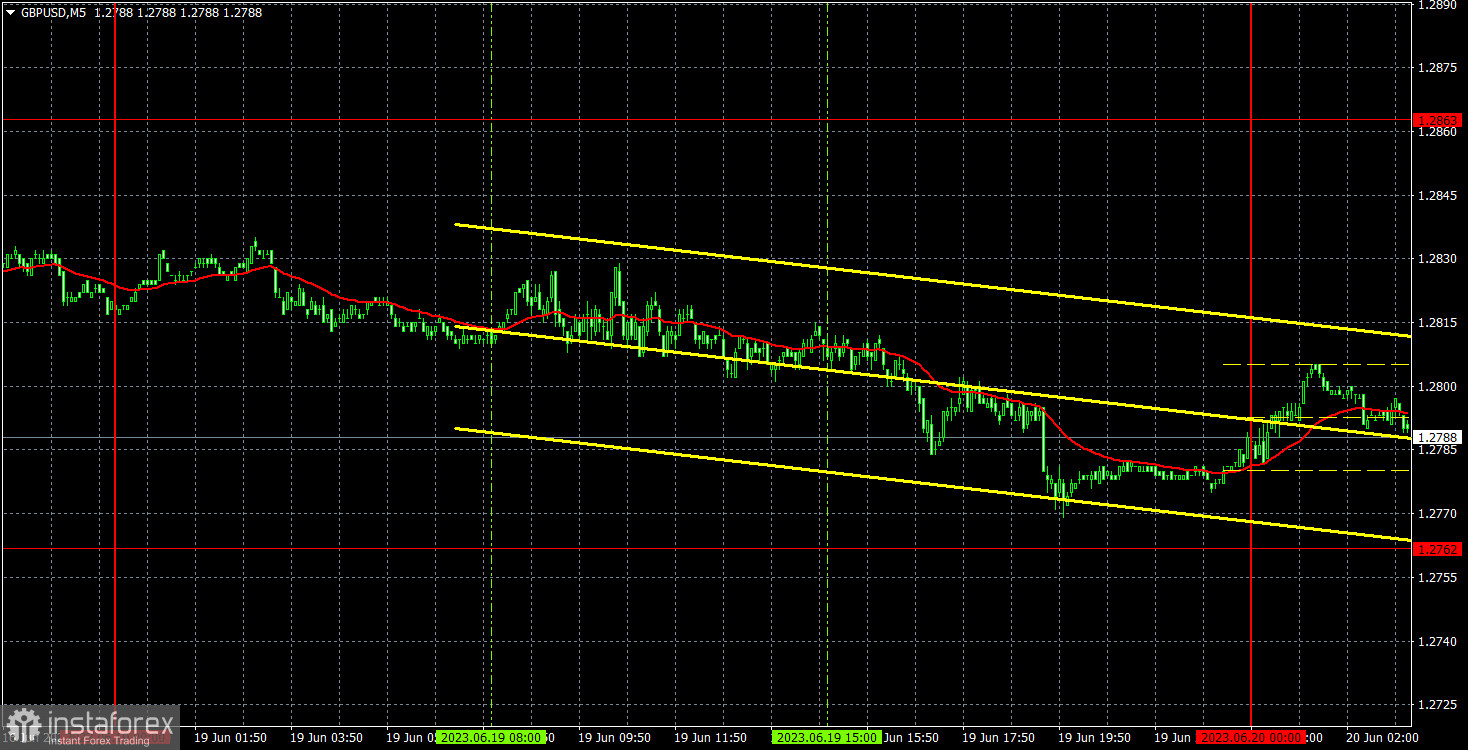
GBP/USD edged down on Monday. This is a classic depiction of how the pound is currently being traded. When it rises, the movement is sharp, but when it falls, it only edges down. It can rise even without macroeconomic or fundamental reasons, but it is reluctant to fall, even when there are corresponding causes. For example, yesterday there was an excellent opportunity for a correction based on pure technicals. The pair could have fallen simply because it was overbought. However, instead of a significant correction, we saw the pair reverse its course by just 30 pips amidst a low-volume trading day. Throughout the day, neither the UK nor the US had any important events or reports.
Speaking of trading signals, there was nothing notable about it. The pair did not even come close to any significant levels or lines. This is probably a good thing because weak movements bordering on a flat can lead to false signals. Traders have been fortunate with the euro, but there simply hasn't been any signal for the pound.
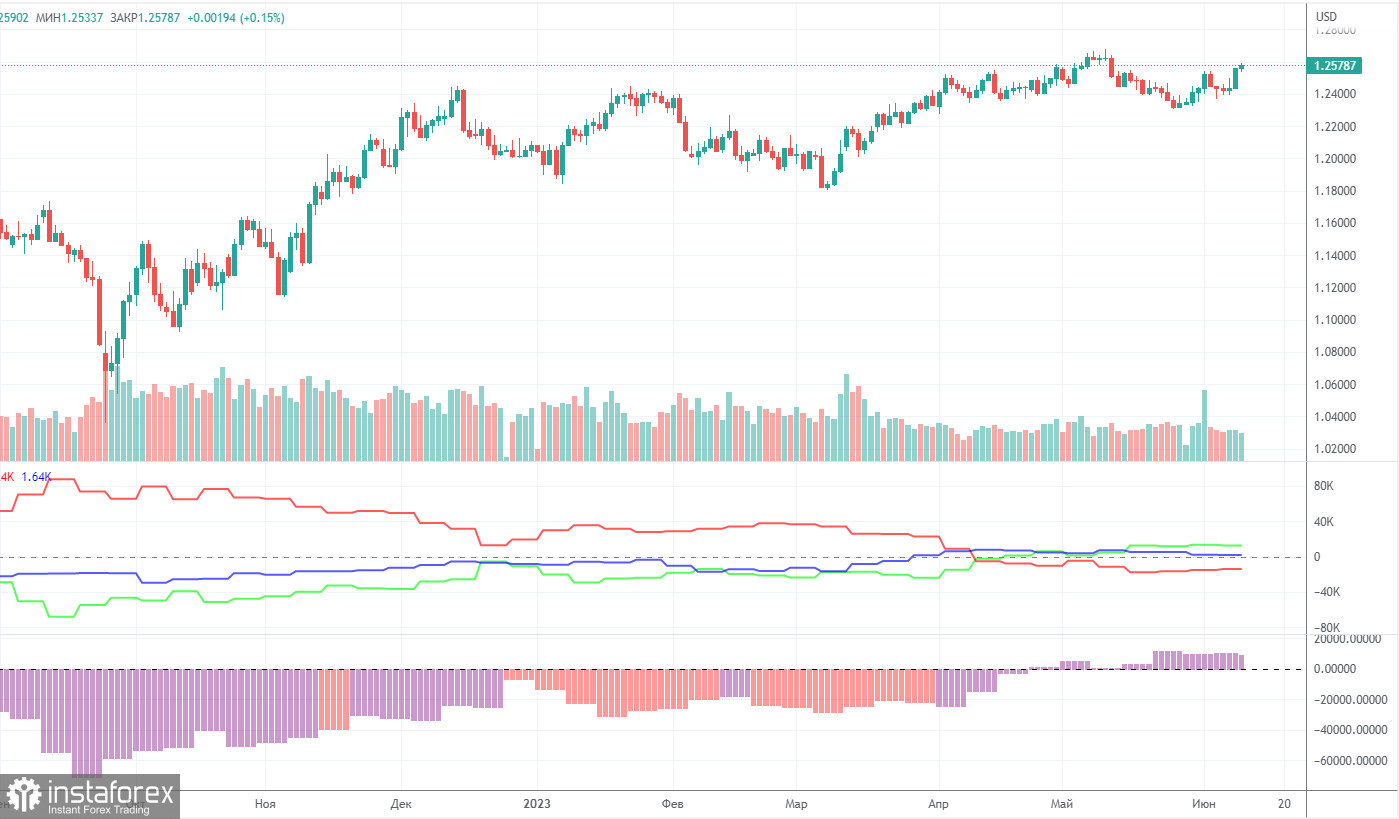
According to the latest report, non-commercial traders closed 5,200 long positions and 4,500 short ones. The net position dropped by 700 but remained bullish. Over the past 9-10 months, the net position has been on the rise despite bearish sentiment. In fact, sentiment is now bullish, but it is a pure formality. The pound is bullish against the greenback in the medium term, but there have been hardly any reasons for that. We assume that a prolonged bear run may soon begin even though COT reports suggest a bullish continuation. However, we can hardly explain why the uptrend should go on.
The pound has gained about 2,300 pips. Therefore, a bearish correction is now needed. Otherwise, a bullish continuation would make no sense even despite the lack of support from fundamental factors. Overall, non-commercial traders hold 52,500 sell positions and 65,000 long ones. We do not see the pair extending growth in the long term.
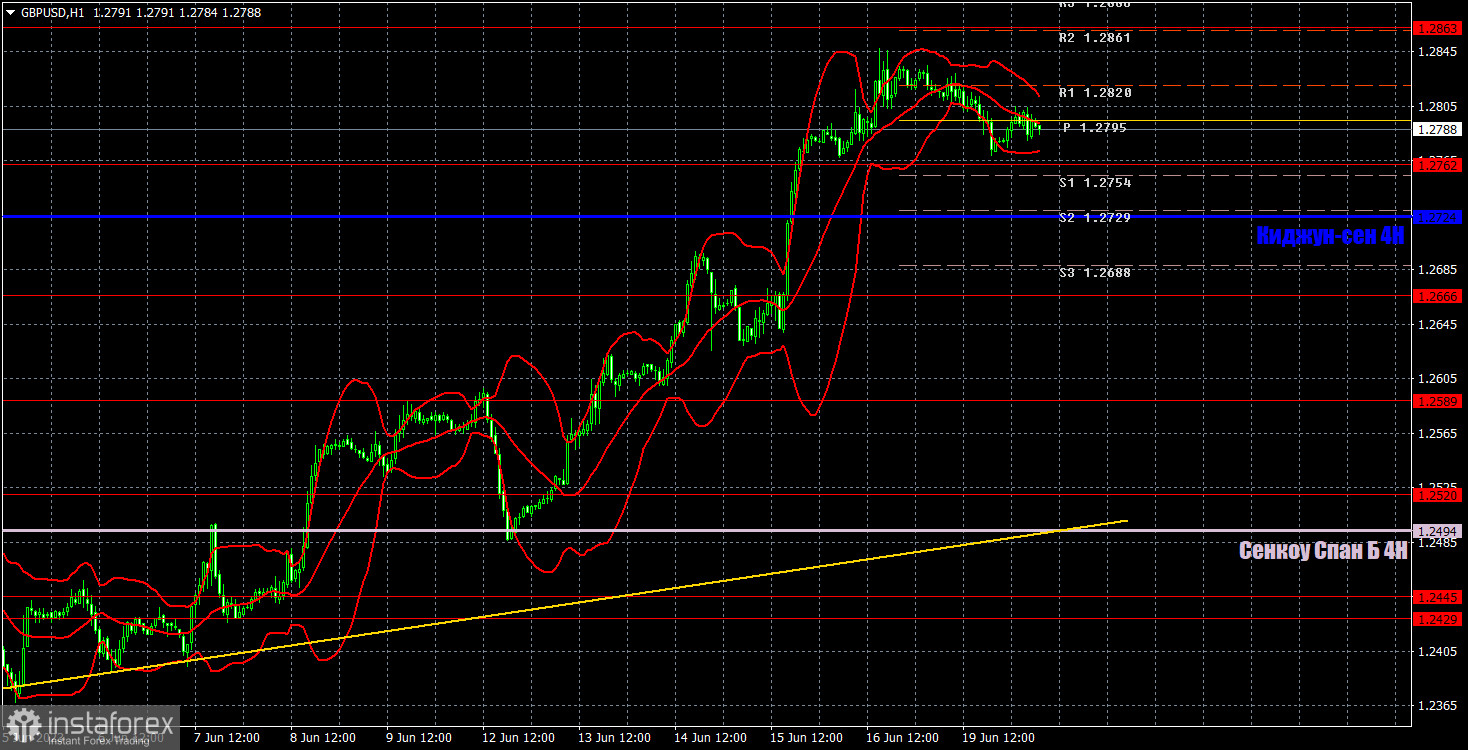
In the 1-hour chart, GBP/USD maintains a bullish bias. The ascending trend line serves as a buy signal but I believe that further growth of the British currency is groundless. The pound sterling has been climbing for too long and downward corrections are short-lived. Judging by the technical indicators, we have an uptrend. Yet, it is hard to find the reasons which may push it higher. However, it is naturally not advisable to sell the pair without proper signals. The market can sustain the trend even without a "fundamental" basis.
On June 20, trading levels are seen at 1.2349, 1.2429-1.2445, 1.2520, 1.2589, 1.2666, 1.2762, 1.2863, 1.2981-1.2987. The Senkou Span B (1.2494) and Kijun-sen (1.2724) may also generate signals when the price either breaks or bounces off them. A Stop Loss should be placed at the breakeven point when the price goes 20 pips in the right direction. Ichimoku indicator lines can move intraday, which should be taken into account when determining trading signals. There are also support and resistance which can be used for locking in profits.
There are no significant events lined up in the UK, and only a few secondary events in the US. We believe that volatility may edge up today, as the Bank of England's meeting and the UK inflation report will be published later this week. The market may start to anticipate and react to this data in advance.
Resistance/support - thick red lines, near which the trend may stop. They do not make trading signals.
The Kijun-sen and Senkou Span B lines are the Ichimoku indicator lines moved to the hourly timeframe from the 4-hour timeframe. They are also strong lines.
Extreme levels are thin red lines, from which the price used to bounce earlier. They can produce trading signals.
Yellow lines are trend lines, trend channels, and other technical patterns.
Indicator 1 on the COT chart is the size of the net position of each trader category.
Indicator 2 on the COT chart is the size of the net position for the Non-commercial group of traders.
InstaForex analytical reviews will make you fully aware of market trends! Being an InstaForex client, you are provided with a large number of free services for efficient trading.

