 Stay
Stay 
Trading Conditions
Products
Tools


All market participants' attention was on the Bank of England meeting outcome. The regulator decided to raise the key rate by 50 basis points to 5%, which exceeded the expectations of analytical agencies that had predicted a 25 basis point increase. This rate level is the highest in the last 15 years. Seven out of nine members of the Monetary Policy Committee voted for the rate hike, while two advocated keeping it at the same level, as indicated in the meeting's statement.
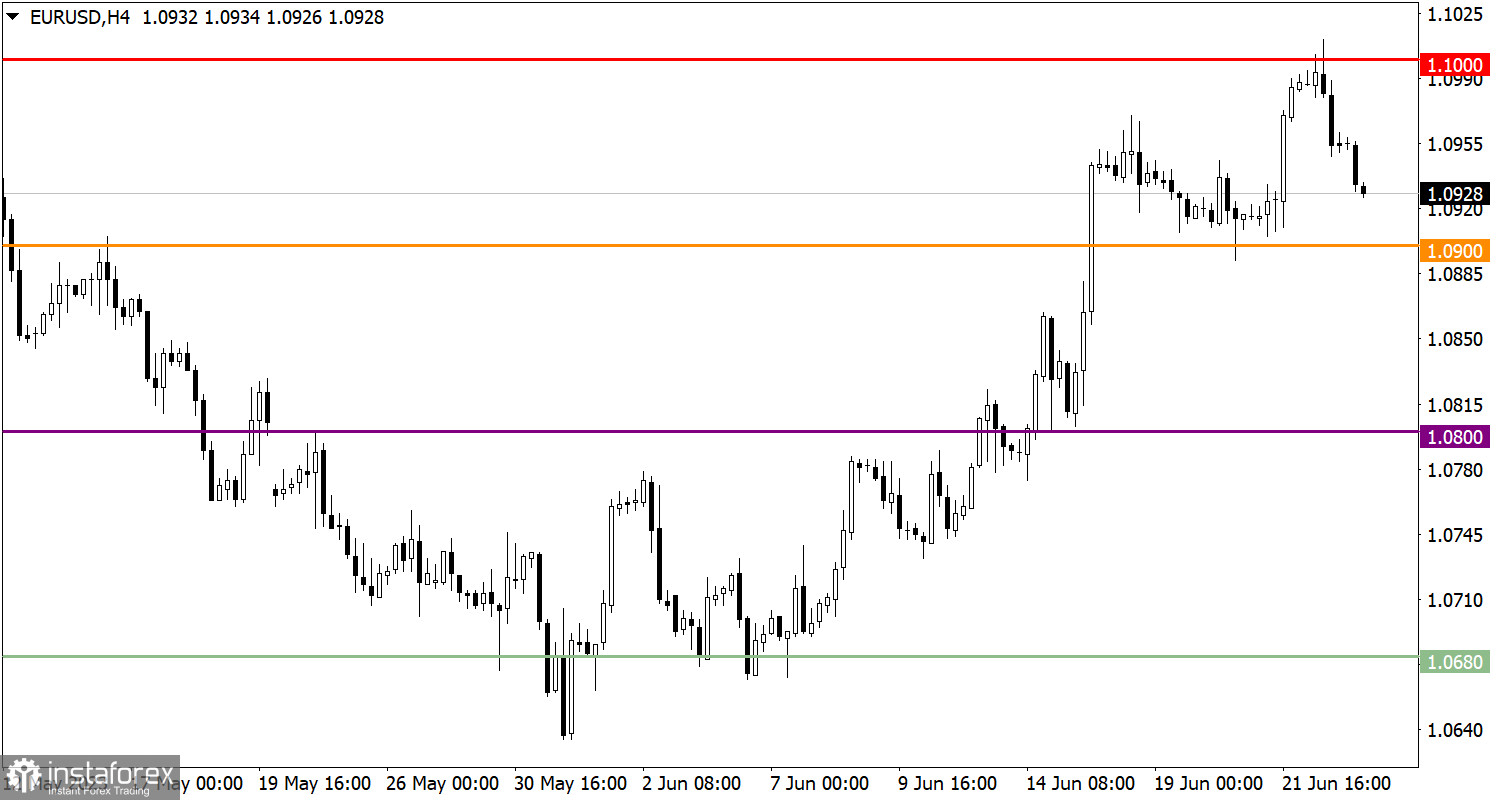
The EUR/USD currency pair rebounded with surgical precision from the psychological level of 1.1000, which led to a pullback and an increase in short positions.
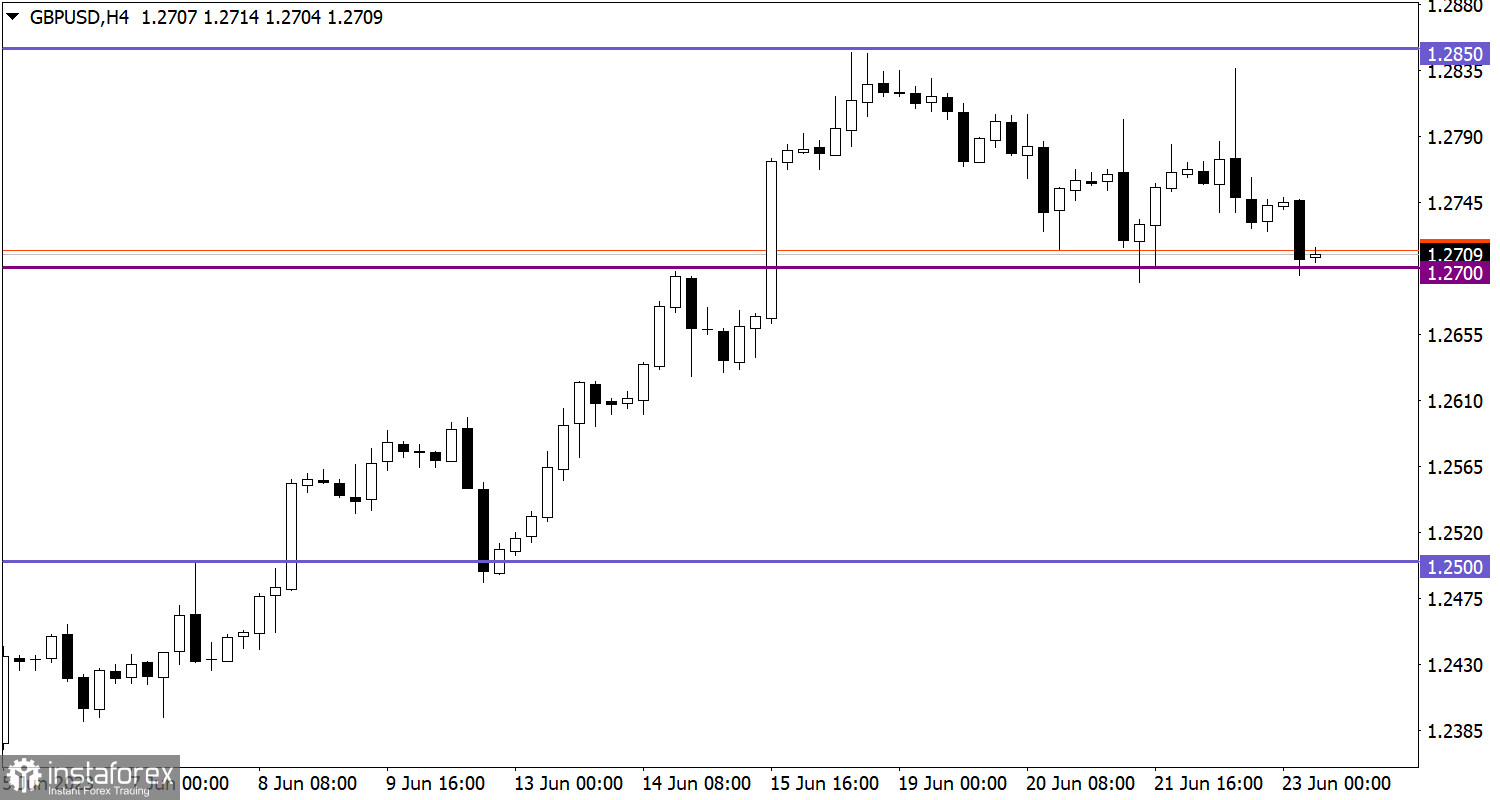
Despite speculative activity, GBP/USD is still in a pullback phase, as confirmed by the price's return to the area around the 1.2700 mark.
With the opening of the European session, data on retail sales in the UK was released, showing a growth of 0.3% in May. The data comparison with the previous year shows that the pace of decline has slowed from -3.0% to -1.7%. This is positive statistics that is causing the British pound to rise.
The publication of business activity indices, which can have an impact on the market, is also expected. However, it should be noted that these data are preliminary and subject to change.
Time targeting:
EU business activity index – 08:00 UTC
UK business activity index – 08:30 UTC
US business activity index – 13:45 UTC
Despite a sufficiently intense downward trend in the market, the upward trend is still intact. A possible return of the price to the area around the level of 1.1000 may lead to its breakout and subsequent growth. Within the downward pullback scenario, the level of 1.0900 is currently considered as the low point.
In this situation, prolonged holding of the price below the level of 1.2700 may lead to further depreciation of the British pound. As long as the price is held at this level, a scenario of slowdown or even a price rebound is possible. The level of 1.2700 serves as an important support, which traders consider in the context of further developments in the market.
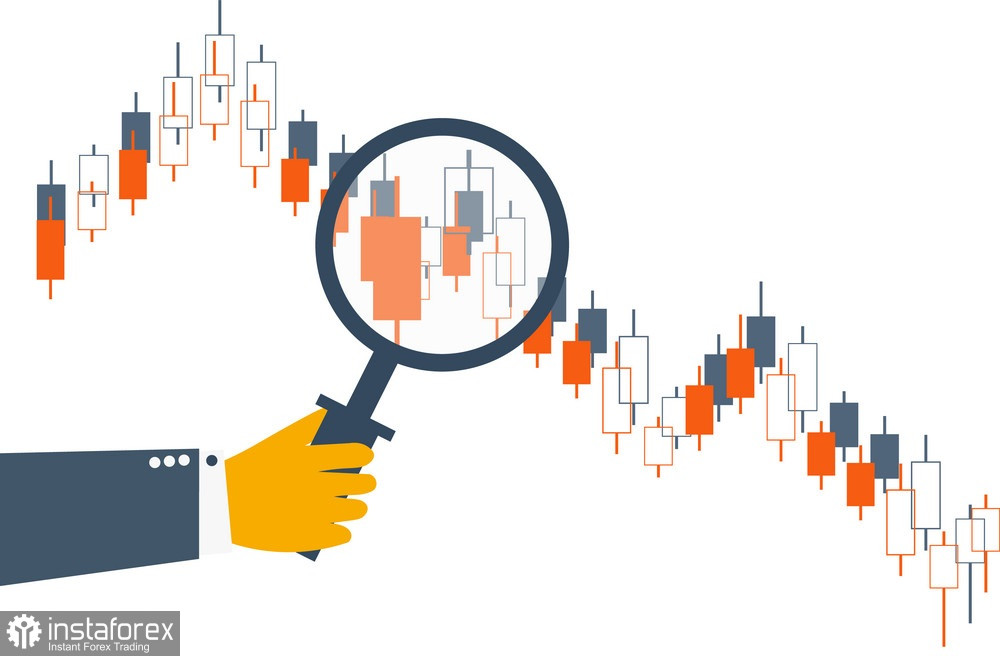
The candlestick chart type is white and black graphic rectangles with lines above and below. With a detailed analysis of each individual candle, you can see its characteristics relative to a particular time frame: opening price, closing price, intraday high and low.
Horizontal levels are price coordinates, relative to which a price may stop or reverse its trajectory. In the market, these levels are called support and resistance.
Circles and rectangles are highlighted examples where the price reversed in history. This color highlighting indicates horizontal lines that may put pressure on the asset's price in the future.
The up/down arrows are landmarks of the possible price direction in the future.
InstaForex analytical reviews will make you fully aware of market trends! Being an InstaForex client, you are provided with a large number of free services for efficient trading.
We may place cookies for analysis of our visitor data, to improve our website and measure advertising performance. Overall this data is used to provide a better website experience. More information
Your IP address shows that you are currently located in the USA. If you are a resident of the United States, you are prohibited from using the services of Instant Trading EU Ltd including online trading, online transfers, deposit/withdrawal of funds, etc.
If you think you are seeing this message by mistake and your location is not the US, kindly proceed to the website. Otherwise, you must leave the website in order to comply with government restrictions.
Why does your IP address show your location as the USA?
Please confirm whether you are a US resident or not by clicking the relevant button below. If you choose the wrong option, being a US resident, you will not be able to open an account with InstaForex anyway.
We are sorry for any inconvenience caused by this message.


