 Stay
Stay 
Trading Conditions
Products
Tools


Details of the macroeconomic calendar on June 26
Yesterday, the macroeconomic calendar was empty. Thus, the EU, the UK, and the United States did not publish any important macroeconomic reports. In such situations, traders and investors usually pay more attention to other sources of information, such as news, statements of central bank officials, or political events that may affect financial markets.
However, it is worth noting that yesterday, there were no significant speeches or statements that could affect financial markets.
Analysis of trading charts seen on June 26:

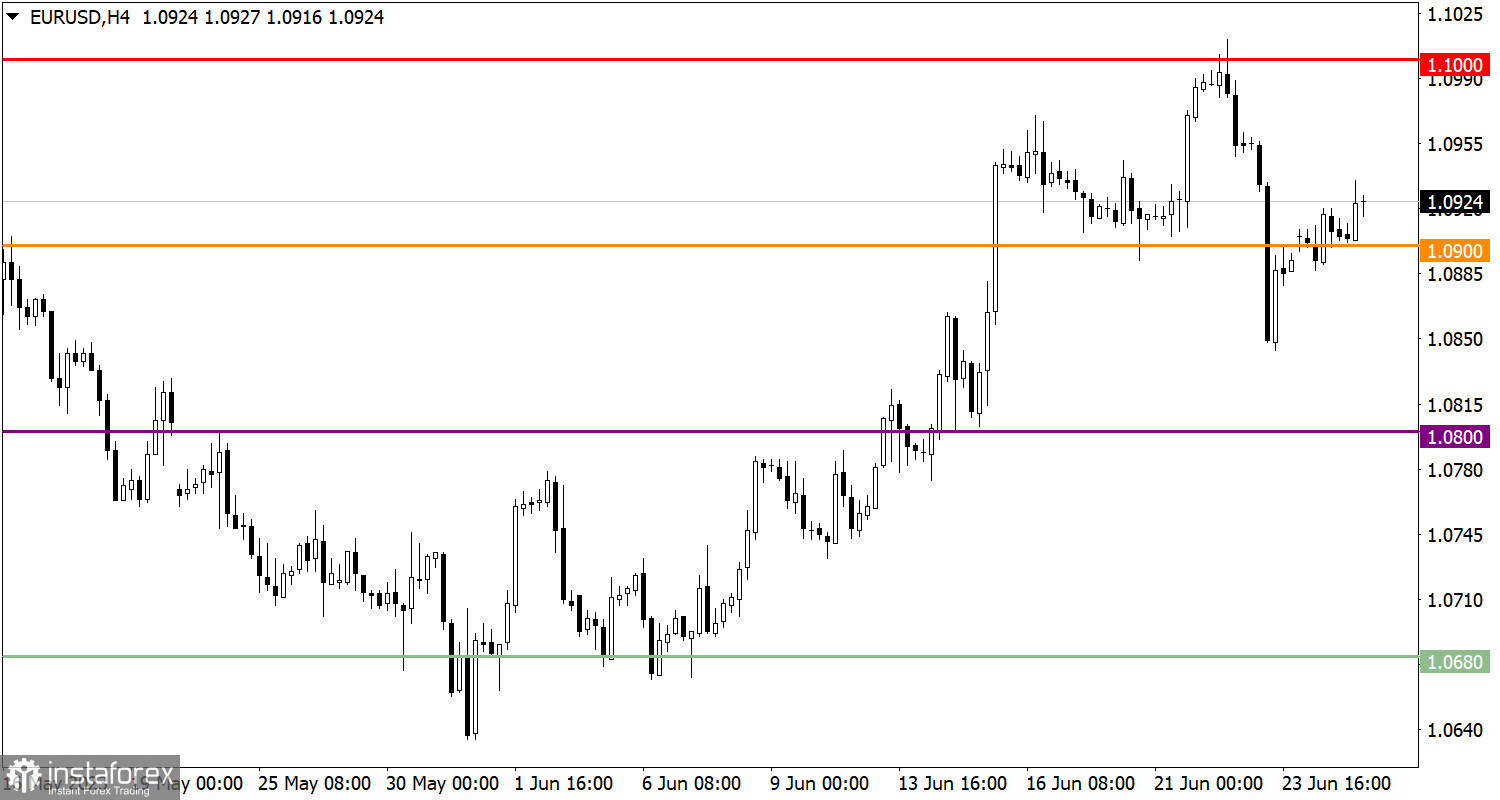
The euro/dollar pair regained more than half of its value after the recent decline. It means that the price has every chance to climb to a new high of the upward cycle.
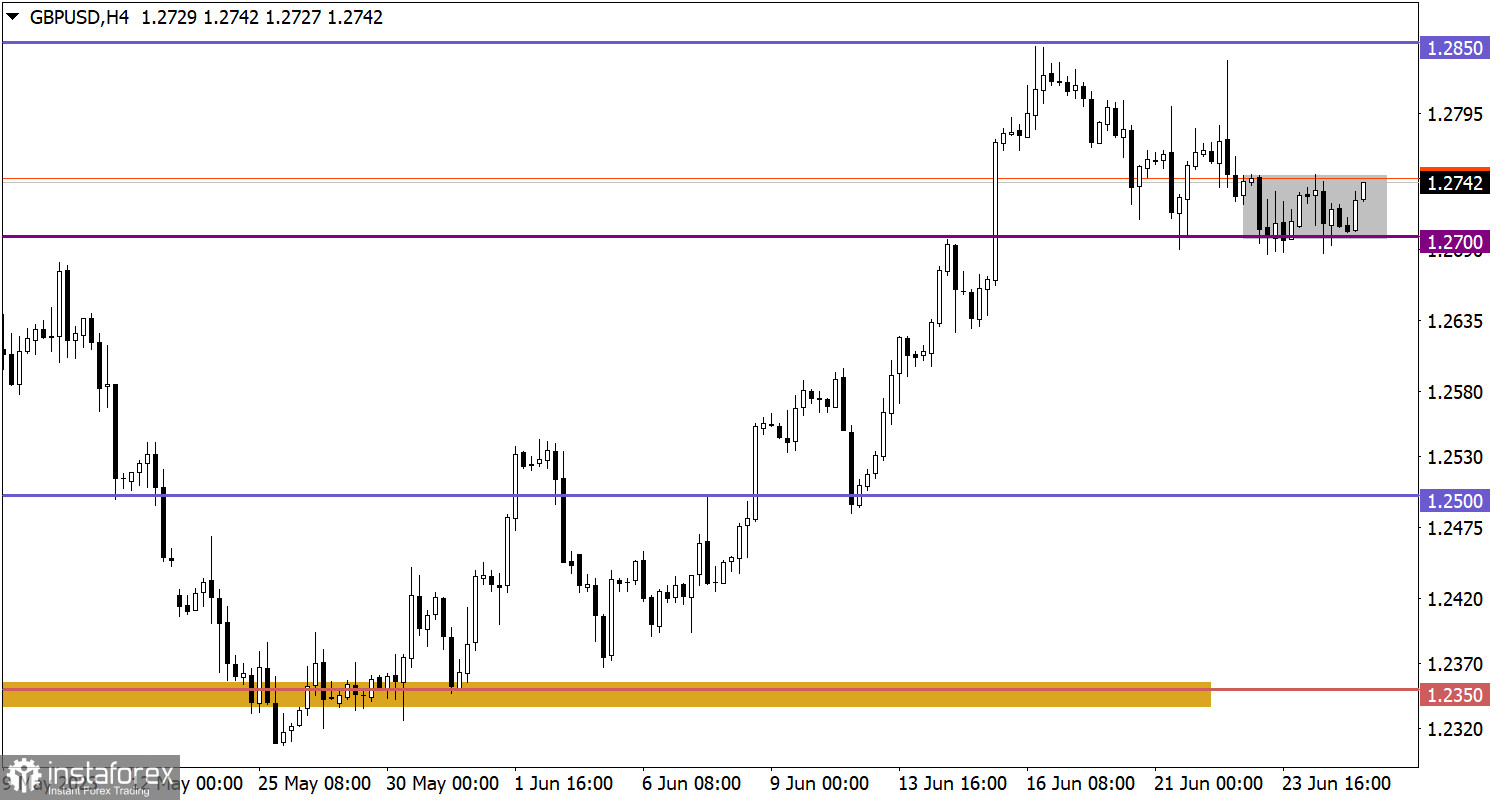
The pound/dollar pair once again bounced off the support level of 1.2700. However, this did not lead to significant changes. The pair is still hovering in the correction zone.
Macroeconomic calendar for June 26:
Today, the publication of data on durable goods orders in the United States for May is expected. Analysts foresee a 1% decrease. If this forecast is confirmed, it will indicate a noticeable reduction in the volume of orders for goods that are typically used for an extended period. Such a reduction may point to a decrease in consumer activity, which plays an important role in economic growth.
Trading plan for EUR/USD on June 27:
The price hovering within the sideways channel between 1.2700 and 1.2750 can serve as an accumulation phase. Sharp price changes are possible. The best strategy is based on the outgoing impulse.
To rise, the price should stay above the level of 1.2750. In the event of this, the pair may recover after the recent correctional movement.
A downward scenario will be considered if the price settles below 1.2700 in the daily period. This may lead to the continuation of the current correction.
Notably, external factors and news can significantly influence price movement. That is why it is recommended to monitor the news and analyze the current market situation.
A downward scenario will be taken into account if the price settles below 1.2700 in the daily period. In this case, the corrective movement will continue.
Trading plan for GBP/USD on June 27:
The price hovering within the range of 1.2700/1.2750 could be defined as an accumulation process. Thus, sharp price changes are possible. The best strategy is based on the outgoing impulse.
Conclusion:
An upward scenario is possible if the price stays above 1.2750. In the event of this, the pair may recoup all the losses caused by the recent corrective movement.
What we see on the trading chart
The candlestick chart consists of rectangles of white and black color with lines at the top and bottom. Making a detailed analysis of each candle, you can see its characteristics relative to a certain time period: the opening price and closing prices, as well as the highest and lowest prices.
Horizontal levels are points where the price may stop or reverse. In trading, these levels are called support and resistance.
Circles and rectangles are examples where the price reversed in history. The color indicates horizontal lines that may exert pressure on the quotes in the future.
Upward/downward arrows are indicators of the potential direction of price in the future.
InstaForex analytical reviews will make you fully aware of market trends! Being an InstaForex client, you are provided with a large number of free services for efficient trading.
Your IP address shows that you are currently located in the USA. If you are a resident of the United States, you are prohibited from using the services of Instant Trading EU Ltd including online trading, online transfers, deposit/withdrawal of funds, etc.
If you think you are seeing this message by mistake and your location is not the US, kindly proceed to the website. Otherwise, you must leave the website in order to comply with government restrictions.
Why does your IP address show your location as the USA?
Please confirm whether you are a US resident or not by clicking the relevant button below. If you choose the wrong option, being a US resident, you will not be able to open an account with InstaForex anyway.
We are sorry for any inconvenience caused by this message.


