 Stay
Stay 
Trading Conditions
Products
Tools


The preliminary inflation assessment for the eurozone in August remained at 5.3% year-on-year. At the same time, core inflation slowed to 5.3% YoY, back at the May level, from 5.5% in June and July.
The EUR/USD currency pair sharply declined after briefly holding the price above the 1.0900 level. This sharp drop may be associated with speculative actions and, as a result, led to an overheating of short positions in the short term.
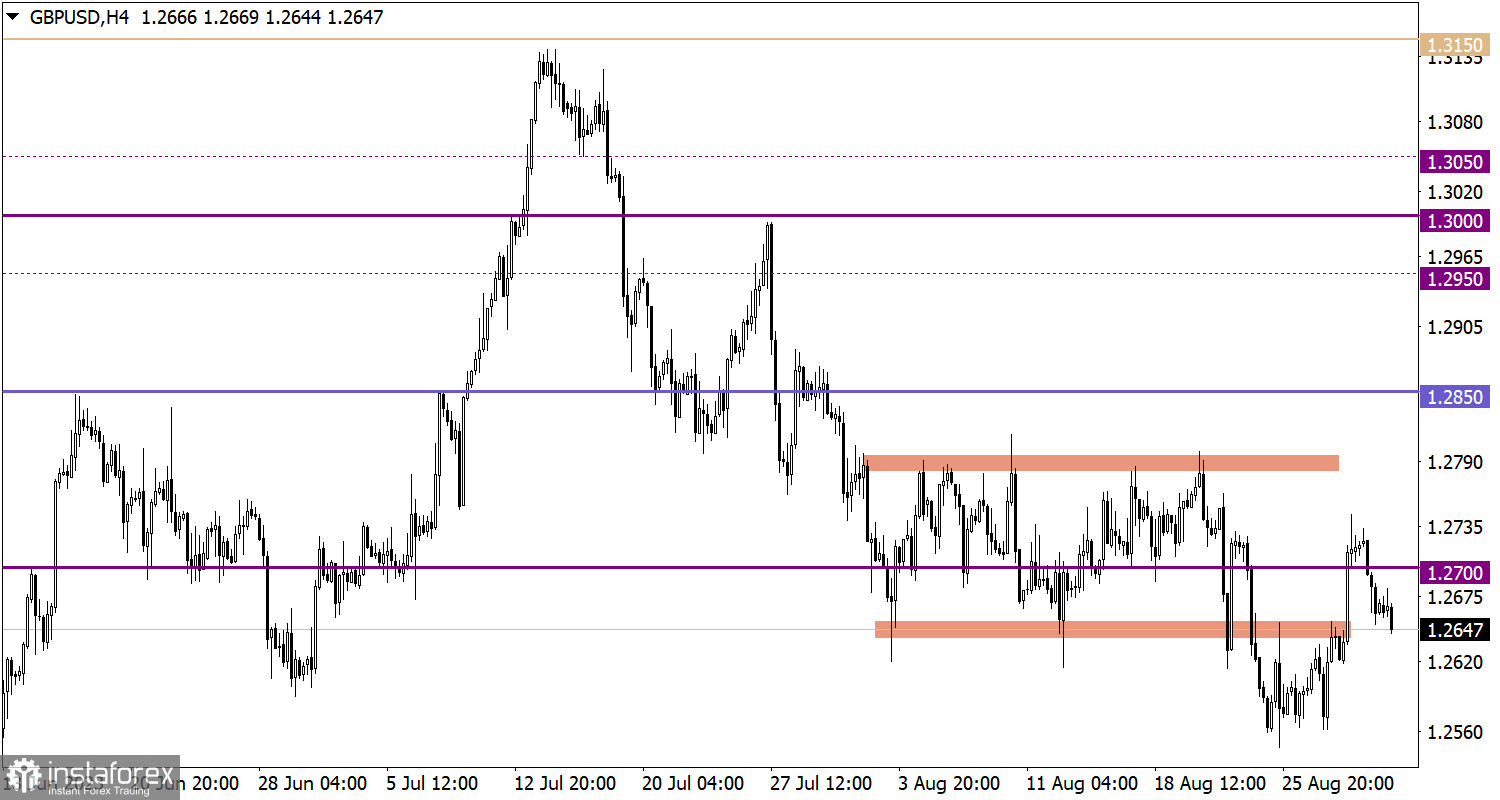
GBP/USD, following the euro, also moved downward, possibly due to a correlation between the trading instruments. Consequently, the quote reached a value of 1.2650.
Today, a report from the United States Department of Labor is expected to be published, which is likely to influence the market and speculators.
The unemployment rate is expected to remain unchanged, while new jobs might be created only in the amount of 170,000. This implies that for the past two months, the number of new jobs has been below 200,000, posing a risk of an increase in the unemployment rate.
Schedule:
United States Department of Labor Report – 12:30 UTC
Based on the technical signal of the euro's overselling, as well as fundamental analysis, a recovery of the euro's rate to values of 1.0900/1.0950 is feasible. Nevertheless, if we rely on the concept of inertial motion, maintaining the price below the 1.0830 level could lead the quote back to the area where the downward cycle begins.

For the subsequent weakening of the pound sterling's rate, it's essential to consistently keep the price below the 1.2650 mark. Otherwise, there's a chance the quote might return to the range of values between 1.2700/1.2750.
The candlestick chart type is white and black graphic rectangles with lines above and below. With a detailed analysis of each individual candle, you can see its characteristics relative to a particular time frame: opening price, closing price, intraday high and low.
Horizontal levels are price coordinates, relative to which a price may stop or reverse its trajectory. In the market, these levels are called support and resistance.
Circles and rectangles are highlighted examples where the price reversed in history. This color highlighting indicates horizontal lines that may put pressure on the asset's price in the future.
The up/down arrows are landmarks of the possible price direction in the future.
InstaForex analytical reviews will make you fully aware of market trends! Being an InstaForex client, you are provided with a large number of free services for efficient trading.
Your IP address shows that you are currently located in the USA. If you are a resident of the United States, you are prohibited from using the services of Instant Trading EU Ltd including online trading, online transfers, deposit/withdrawal of funds, etc.
If you think you are seeing this message by mistake and your location is not the US, kindly proceed to the website. Otherwise, you must leave the website in order to comply with government restrictions.
Why does your IP address show your location as the USA?
Please confirm whether you are a US resident or not by clicking the relevant button below. If you choose the wrong option, being a US resident, you will not be able to open an account with InstaForex anyway.
We are sorry for any inconvenience caused by this message.


